


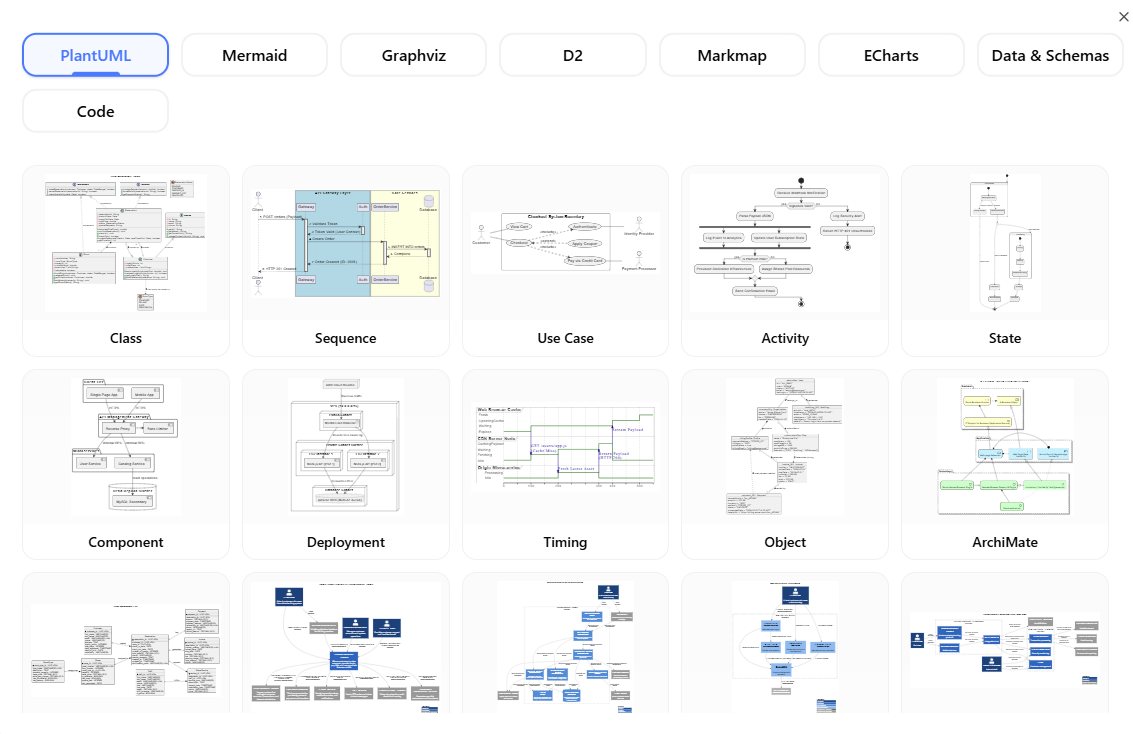
In the world of software engineering, documentation is as critical as the code itself. However, maintaining complex diagrams in image editors is a nightmare. PlantUML solves this problem by allowing developers to describe diagrams using a simple text language, which is then rendered into professional visualizations automatically. This tutorial explores the core architecture and system models available within the PlantUML ecosystem, focusing on the ten primary diagram types demonstrated in the interface.
Understanding the PlantUML Architecture
PlantUML operates on a text-to-diagram philosophy. Instead of dragging and dropping boxes, you write structured text definitions. The system parses this text and generates a vector graphic (usually PNG, SVG, or PDF) representing the software architecture. The interface shown in the context highlights the versatility of the tool, categorizing diagrams into structural and behavioral models.
Structural Diagrams: Visualizing the Blueprint
Structural diagrams focus on the static aspects of a system. They define the components, their relationships, and how they are deployed.
1. Class Diagrams
The Class Diagram is the backbone of object-oriented design. It visualizes the classes, their attributes, methods, and the relationships between them (inheritance, association, aggregation).
- Use Case: Defining the scope of a system and the roles of actors.
- Key Feature: Supports interfaces, abstract classes, and stereotypes.
Example Concept: You define a class using the class keyword and link them with arrows representing relationships like --> (association) or <|-- (inheritance).
2. Component Diagrams
Component diagrams provide a higher-level view than class diagrams. They focus on the software components, which are modular parts of a system that can be independently deployed.
- Use Case: Architectural design of large systems, showing how libraries or services interact.
- Visuals: Typically represented by boxes with a specific "component" icon.
3. Deployment Diagrams
While class diagrams show code structure, deployment diagrams show the physical hardware. They map software artifacts (like executables or databases) to physical nodes (servers, devices, clouds).
- Use Case: DevOps and infrastructure planning.
- Key Elements: Nodes, artifacts, and communication paths.
4. Object Diagrams
An Object Diagram is a snapshot of the system at a specific point in time. While a class diagram defines the type, an object diagram defines the instance.
- Use Case: Debugging complex object relationships or documenting a specific state of the system.
5. ArchiMate Diagrams
ArchiMate is an open and independent enterprise architecture modeling language. PlantUML supports ArchiMate to bridge the gap between business architecture and IT architecture.
- Use Case: Modeling business processes, organization structures, and their relationship to applications and technology.
Behavioral Diagrams: Visualizing Dynamics
Behavioral diagrams describe how a system behaves over time, focusing on interactions and state changes.
6. Sequence Diagrams
Perhaps the most popular diagram in PlantUML, the Sequence Diagram shows how objects interact with one another over time. It is laid out vertically with time flowing downwards.
- Key Elements: Lifelines (vertical dotted lines) and Messages (horizontal arrows) representing method calls.
- Visuals: Can include activation bars to show when an object is performing a task.
7. Use Case Diagrams
Use Case diagrams capture the functional requirements of a system. They depict the "who" and the "what" of the system from a user's perspective.
- Key Elements: Actors (stick figures) and Use Cases (ovals).
- Relationships: Shows how users interact with system features.
8. Activity Diagrams
Activity diagrams are essentially flowcharts. They model the flow of control from activity to activity, handling logic, conditions, and concurrency.
- Use Case: Modeling business processes or algorithms.
- Visuals: Uses diamonds for decision points and bars for parallel processing (swimlanes).
9. State Diagrams (State Machine)
A State Diagram shows the different states an object can be in and the events that cause transitions between those states.
- Use Case: Complex objects with complex lifecycles (e.g., an Order object moving from "Placed" to "Shipped" to "Delivered").
10. Timing Diagrams
Timing diagrams are specialized sequence diagrams that focus on the timing of messages. They are crucial for real-time systems.
- Key Feature: The horizontal axis represents time, allowing for precise visualization of intervals and deadlines.
How to Get Started
To utilize the architecture shown in the interface:
- Select the Diagram Type: Click on the desired icon (e.g., "Sequence" or "Class").
- Write the Code: Enter your PlantUML code in the "Code" editor. The syntax is intuitive, using keywords like
@startumland@endumlto wrap your content. - Render: The system automatically parses the text and generates the visual diagram on the right.
By mastering these ten diagram types, developers can create a complete, living documentation suite for their software architecture, ensuring that the visual representation of the system is always in sync with the code.

