In the world of business process modeling, clarity is paramount. This tutorial explores a sophisticated Business Process Model and Notation (BPMN) diagram captured within the Visual Paradigm Enterprise environment. The diagram illustrates the complex nomination workflow for the Nobel Prize in Medicine. By breaking down this visual representation, we can understand how organizations manage intricate, multi-party processes involving internal committees and external stakeholders.
1. The Architecture of Cross-Functional Flows
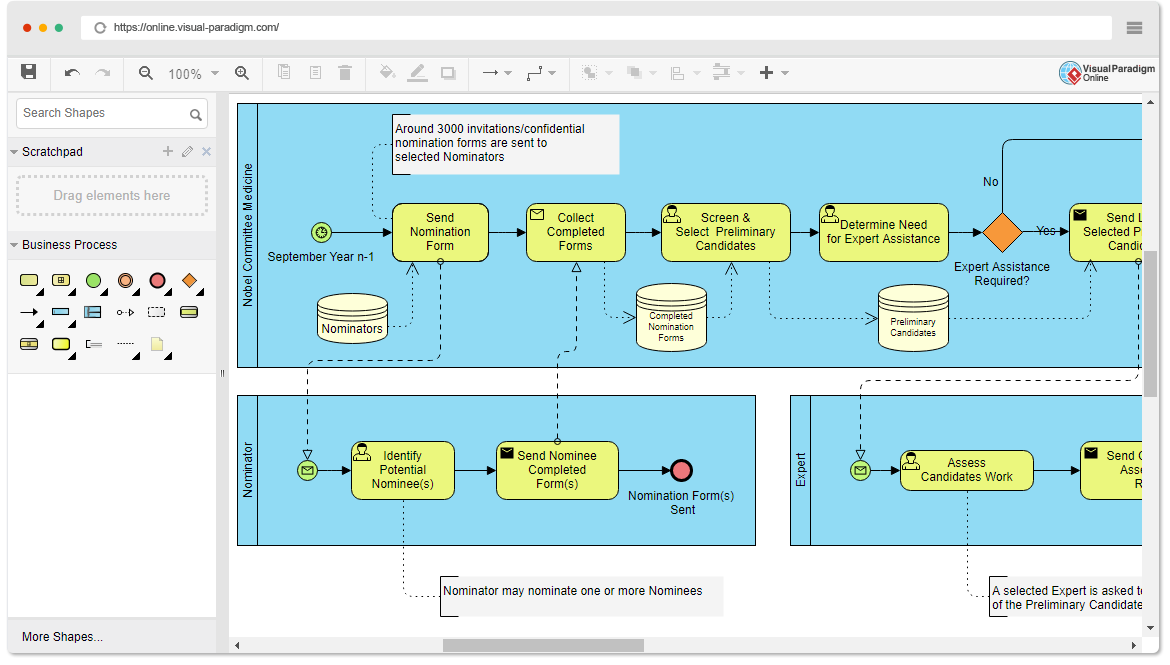
The most striking feature of this diagram is its use of Swimlanes (also known as Pools). Swimlanes provide a visual separation of responsibilities, ensuring that every participant knows exactly where their tasks begin and end. In this specific model, the architecture is divided into three distinct vertical lanes:
- Nobel Committee Medicine (Top Lane): This represents the central governing body. They initiate the process, manage data, and make final decisions.
- Nominator (Bottom Left Lane): This represents external individuals invited to suggest candidates. Their role is passive until activated by the Committee.
- Expert (Bottom Right Lane): This represents specialized academics or scientists called upon to evaluate specific work.
2. Step-by-Step Process Walkthrough
The process flows chronologically from left to right, starting in September Year n-1 (indicating the nomination phase occurs the year before the award is given). Let’s trace the lifecycle of the data:
Phase 1: Initiation and Invitation
The process begins with a Start Event (the green circle) within the Committee lane. The Committee sends out approximately 3,000 nomination forms to selected Nominators. This action is represented by a Data Object (an envelope icon) labeled “Nomination Form.”
Phase 2: The Nominator’s Contribution
Following the dashed association line down to the Nominator lane, the process triggers a task: “Identify Potential Nominee(s)”. The Nominator performs their evaluation and completes the form. The task concludes with the action “Send Nominee Completed Form(s)”, represented by a data object leaving the swimlane and re-entering the Committee lane.
Phase 3: Screening and Selection
Once the forms return, the Committee executes a series of tasks: “Collect Completed Forms” and “Screen & Select Preliminary Candidates”. The Committee maintains a Data Store (cylinder icon) labeled “Completed Nomination Forms” to archive these submissions. They then move to a second data store, “Preliminary Candidates.”
Phase 4: The Decision Gateway
A critical control point is reached at the diamond-shaped Exclusive Gateway labeled “Expert Assistance Required?”. This is a binary decision point:
- Yes: If the Committee determines the candidates need specialized review, the flow moves to the “Expert” lane.
- No: The process loops back or proceeds to the next internal stage (implied by the loop structure).
Phase 5: Expert Assessment
If assistance is required, the Committee sends a list of candidates to the Expert. The Expert performs the task “Assess Candidates” and generates a “Send Candidates Assessment Report”. This report is a critical data object that travels back up to the Committee lane.
3. Technical Notation and Symbols Explained
Visual Paradigm adheres to strict BPMN standards. Here is a breakdown of the symbols used in this architecture:
Tasks (Rounded Rectangles)
The yellow rounded rectangles represent specific activities. For example, “Screen & Select Preliminary Candidates” is a manual task performed by a human actor.
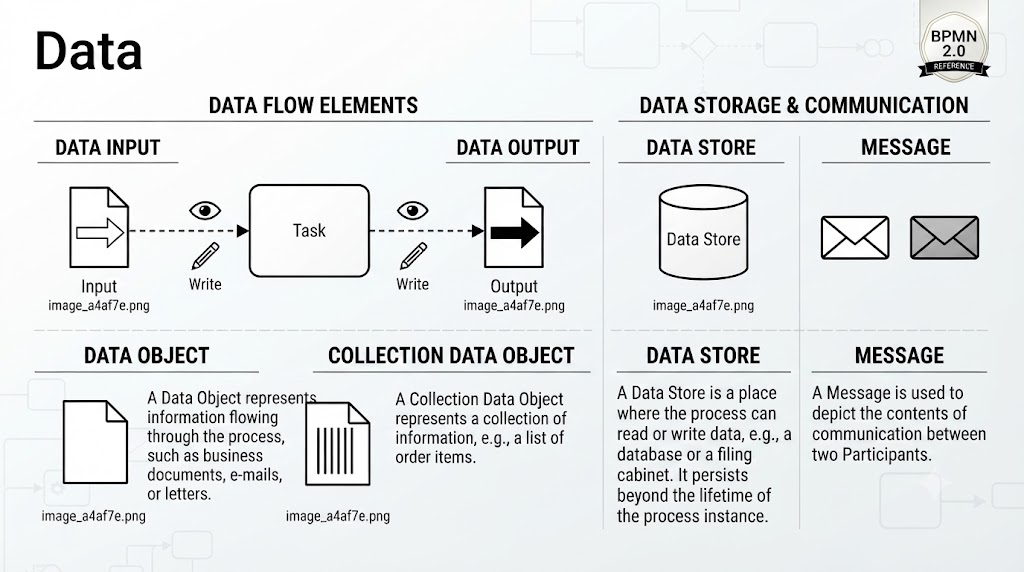
Data Objects (Envelopes)
The envelope icons represent information artifacts. Notice how they interact with the lanes:
- Nomination Form: Moves from Committee to Nominator.
- Candidates Assessment: Moves from Expert back to Committee.
Data Stores (Cylinders)
The cylinder icons (e.g., “Nominators”, “Preliminary Candidates”) represent persistent storage. The Committee does not just process data in a vacuum; they rely on databases or file systems to retain the history of nominations.
Associations (Dashed Lines)
The dashed lines are crucial for “Data Association.” They show that a specific task (like “Identify Potential Nominee(s)”) requires specific data (the invitation) or produces specific output (the completed form). They bridge the gap between the process logic and the information flow.
4. Key Takeaways for Modelers
When modeling complex systems like this, always consider the Context. A model that only shows the Committee’s internal steps is incomplete because it ignores the external inputs (Nominators) and specialized inputs (Experts). By using swimlanes and clear data associations, this diagram ensures that:
- Responsibility is clear: Everyone knows who does what.
- Data flow is tracked: We can see exactly where a form goes from creation to final assessment.
- Exceptions are handled: The decision gateway allows the process to adapt dynamically based on the needs of the specific year’s candidates.