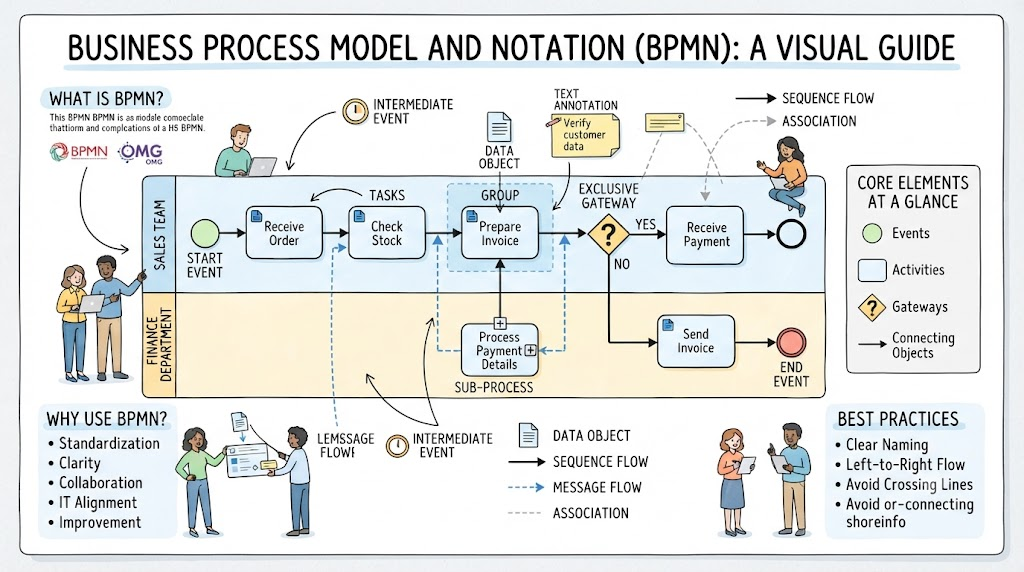
Welcome to this comprehensive guide on Business Process Model and Notation (BPMN). As organizations strive for operational efficiency, the ability to visualize complex workflows is paramount. BPMN serves as the universal language for business analysts, developers, and stakeholders to map out exactly how work gets done. In this tutorial, we will dissect the anatomy of a BPMN diagram, exploring the core elements, the flow of information, and the architectural best practices illustrated in standard process models.
1. The Core Elements of BPMN
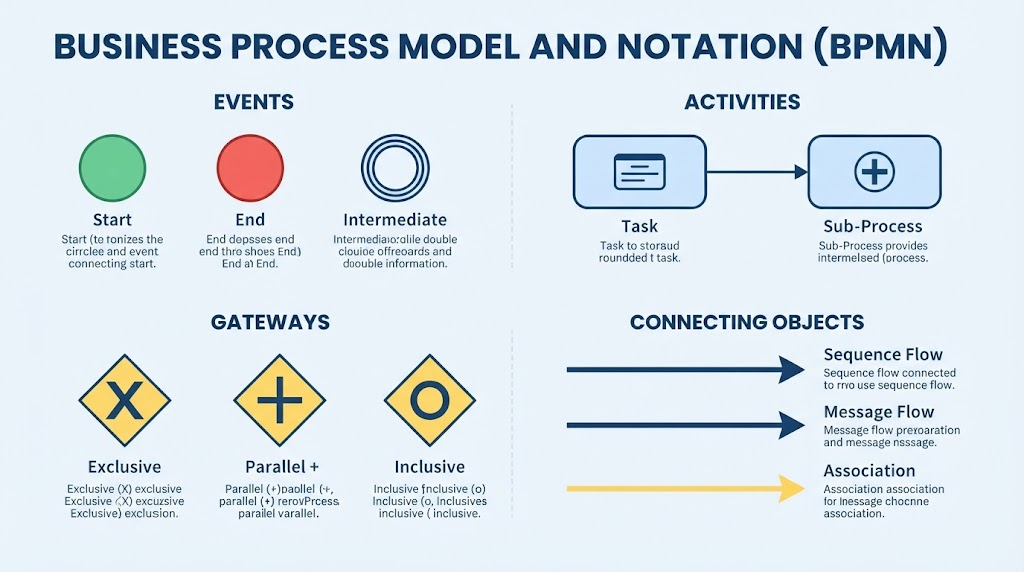
Before drawing a single line, one must understand the building blocks of the BPMN notation. The visual guide categorizes these elements into four distinct types, each serving a specific purpose in the modeling lifecycle.
Events: The Triggers and Outcomes
Events are represented by circles. They signify something that happens during a process.
- Start Event: A green circle indicates the beginning of a process. In our example, the process is triggered when a customer initiates an order.
- End Event: A red circle marks the conclusion of the process, such as the finalization of payment.
- Intermediate Event: A circle with a double border (often with a clock or message icon) represents something that occurs in the middle of the process, like waiting for data or a time delay.
Activities: The Work
Activities are the tasks performed within a process. They are depicted as rounded rectangles.
- Tasks: These are the smallest unit of work, such as “Receive Order” or “Check Stock.”
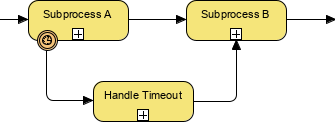
- Sub-Process: A rounded rectangle with a plus sign (e.g., “Process Payment Details”) indicates a nested process. This allows for complex logic to be hidden inside a single box until a deeper level of detail is required.
Gateways: The Decisions
Gateways control the divergence and convergence of paths. They determine where the process goes next based on conditions.
- Exclusive Gateway: The diamond shape is crucial for logic. It represents a decision point (e.g., “YES” or “NO”). In the diagram, the system checks a condition; if the answer is “YES,” it proceeds to receive payment. If “NO,” it might take a different path, such as sending a follow-up invoice.
2. Connecting the Dots: Flow and Relationships
How do these elements interact? The arrows and lines connecting the shapes define the logic and data movement.
- Sequence Flow: Represented by a solid arrow with a classic arrowhead. This shows the order of activities. For instance, after “Receive Order,” the flow moves to “Check Stock.”
- Message Flow: Dashed arrows indicate communication between different participants (swimlanes). In the diagram, a message flow connects the Sales Team and the Finance Department, showing how information is passed between departments.
- Association: Dotted lines connect artifacts (like text annotations or data objects) to specific process elements without affecting the flow of logic.
3. Anatomy of the Example Process: “Order Fulfillment”
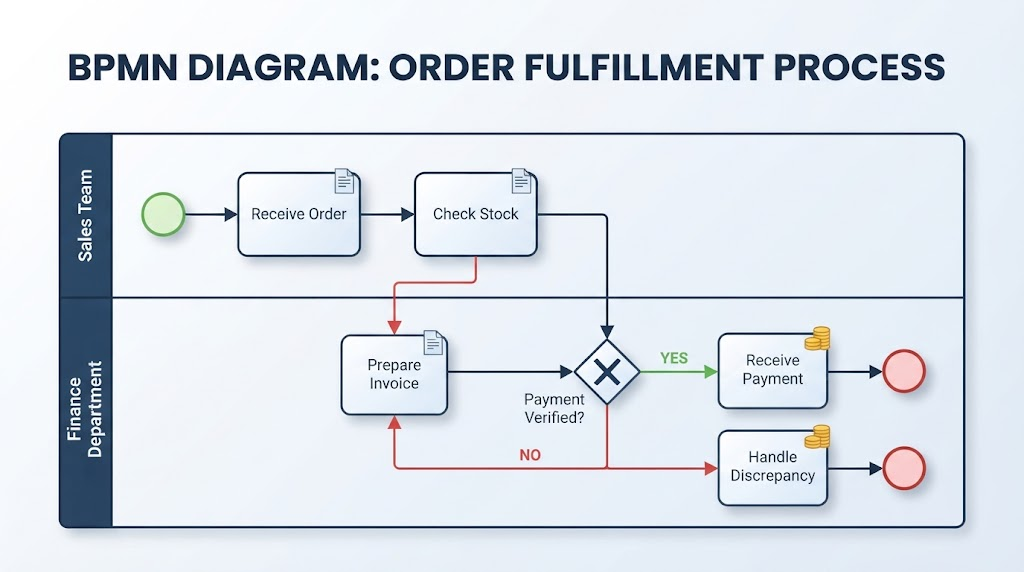
Let’s walk through the specific scenario depicted in the central diagram. This process is divided into Swimlanes, which separate responsibilities.
The Sales Team Lane
The process begins here. The Sales Team initiates the workflow by performing the Receive Order task. Following this, they must Check Stock to ensure the item is available.
The Finance Department Lane
Once stock is confirmed, the process moves to the Finance Department. Here, they Prepare Invoice. This task is grouped with others, suggesting a logical cluster of work. The process then hits a decision point (Exclusive Gateway): Has the payment been verified?
Handling the “YES” Path
If the verification is successful (YES), the process moves to Receive Payment and concludes with an End Event.
Handling the “NO” Path
If the condition is not met, the flow directs to Send Invoice (likely requesting further action or payment details) before eventually reaching the end state.
4. Advanced Modeling Concepts
Beyond simple linear flows, BPMN supports complex structures to model real-world scenarios accurately.
Data Objects and Annotations
Process diagrams often need to reference specific data.
- Data Objects: Represented by a page icon (e.g., the document icon near “Prepare Invoice”). These show the input or output data required for a task.
- Text Annotations: These provide context. For example, the note “Verify customer data” attached to the gateway clarifies the logic behind the decision.
Groups
A dashed box labeled “GROUP” is used to visually cluster related tasks without implying a logical connection or a sub-process. It is purely for organizational clarity, helping the reader understand that “Prepare Invoice” is part of a specific billing phase.
5. Best Practices for Effective Modeling
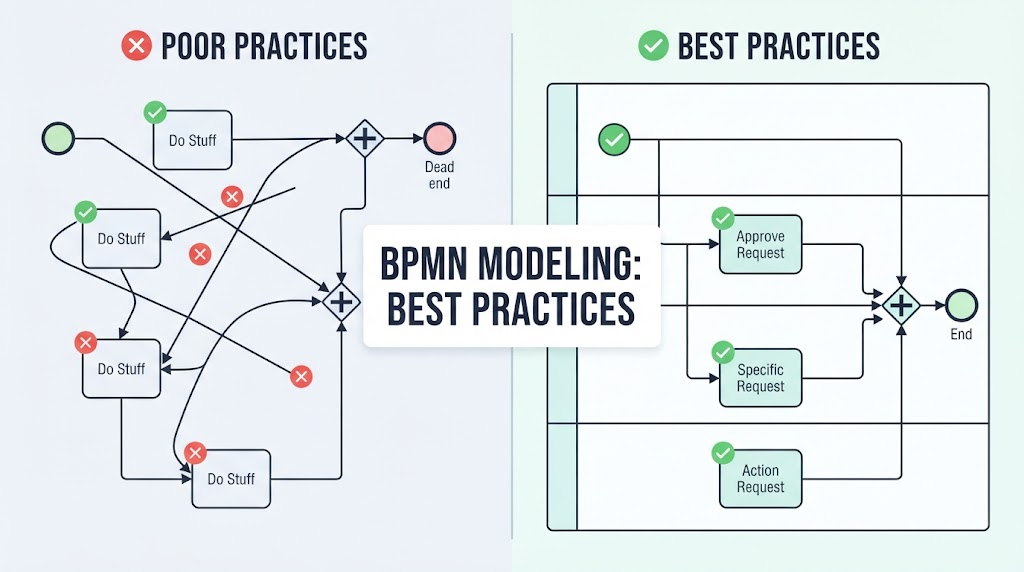
To ensure your BPMN diagrams are effective tools for communication rather than confusing artifacts, adhere to these best practices highlighted in the guide:
- Clear Naming: Always use action-oriented labels (e.g., “Receive Order” instead of just “Order”).
- Left-to-Right Flow: Maintain a consistent reading direction to reduce cognitive load.
- Avoid Crossing Lines: A clean diagram is a readable diagram. If lines cross, rearrange the swimlanes or elements.
- Avoid Dead Ends: Ensure that every gateway and process branch has a clear path to an End Event. Avoid scenarios where the process stops without resolution.
By mastering these elements and adhering to these standards, organizations can achieve the “Alignment with IT Systems” and “Continuous Improvement” necessary to thrive in a competitive market.