


In the realm of software engineering, managing complex system behaviors can feel like trying to untangle a massive knot of threads. While Sequence Diagrams are excellent for detailing the precise timing and exchange of messages between objects, they often hit a ceiling when the logic branches out into loops, conditional paths, or multiple sub-scenarios. This is where the Interaction Overview Diagram (IOD) becomes an indispensable tool in your architectural toolkit.
Based on the analysis of the diagram provided in Visual Paradigm Enterprise, this tutorial will walk you through how to structure a high-level “Inspection Process” by orchestrating multiple sequence diagrams into a cohesive workflow.
What is an Interaction Overview Diagram?
An Interaction Overview Diagram is essentially a hybrid between an Activity Diagram and a Sequence Diagram. It provides a high-level view of complex interactions by combining multiple sequence diagrams. Think of it as a roadmap for intricate scenarios.
Just as an Activity Diagram uses nodes and transitions to represent the flow of control, the IOD uses Interaction Nodes (which represent Sequence Diagrams) and Control Nodes (such as decision diamonds and black bars for synchronization) to define the logic that links these interactions together.
Deconstructing the Example: The Inspection Process
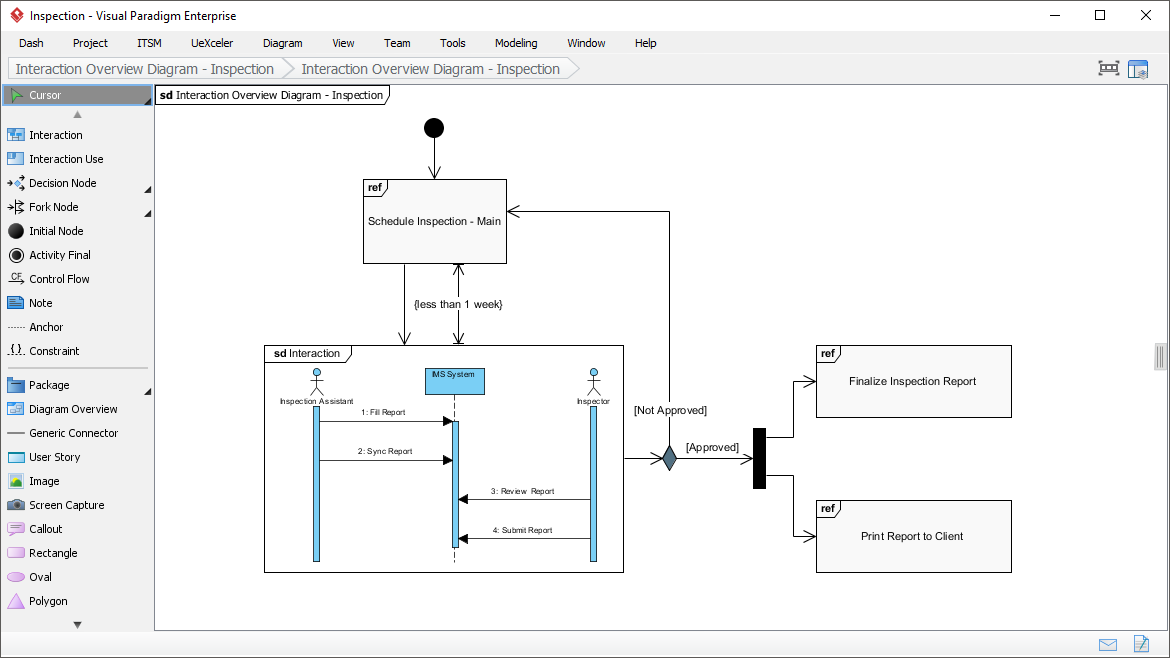
Let’s analyze the structure shown in the screenshot. The diagram models a process where an inspection report is created, reviewed, and either finalized or sent back for revision.
1. The Entry Point and Initial Interaction
The process begins at the top with a black circle, representing the Initial Node. The flow immediately enters the primary interaction sequence.
- Interaction Node: The large box labeled
sd Interactionacts as a reference to a specific Sequence Diagram. Inside this box, we see the detailed lifelines of Inspection Assistant, MS System, and Inspector. - The Flow: The Assistant initiates the process by
1: Fill Reportand2: Sync Report. The Inspector then responds with3: Review Reportand4: Submit Report.
2. The Decision Logic
Once the sequence sd Interaction completes, the control flow reaches a Decision Node (represented by a diamond shape). This node is critical for handling conditional logic.
- Condition [Approved]: If the report is approved, the flow moves to the right, triggering the interaction Print Report to Client.
- Condition [Not Approved]: If the report is not approved, the flow travels upwards to the interaction Finalize Inspection Report.
3. Loops and Control Flow
Notice the arrow returning from the Finalize Inspection Report node back to the top of the main interaction. This represents a loop. If the report is rejected, the system forces a re-evaluation or re-submission of the data.
Additionally, there is a loop labeled {less than 1 week} pointing back to the Schedule Inspection – Main node. This suggests a control condition where if the scheduling time is within a specific constraint, the process may cycle or reset.
Step-by-Step: How to Model This Scenario
To recreate this architecture in Visual Paradigm, follow these logical steps:
- Create the Interaction Nodes: First, create the individual Sequence Diagrams you want to use (e.g., sd Interaction, Finalize Inspection Report, Print Report to Client). In Visual Paradigm, these are often referred to as “Interaction Use” or “Interaction Reference” nodes when placed on an IOD.
- Set the Initial Node: Drag the black circle Initial Node onto the canvas. Connect it to your primary interaction node.
- Implement Control Flow: Use the Control Flow tool to connect the end of the first interaction to the next logical step.
- Add Decision Nodes: To handle the “Approved” vs. “Not Approved” logic, insert a Decision Node. Connect the output of the sequence diagram to this diamond.
- Label the Paths: Right-click the outgoing edges from the decision node to label them with guard conditions (e.g.,
[Approved]and[Not Approved]). - Create Loops: Connect the outputs of the decision nodes to their respective interaction nodes. Then, connect the “Not Approved” path back to the start of the loop to create the feedback mechanism.
Understanding the Syntax
When modeling these nodes, you are essentially defining a graph structure. While Visual Paradigm is a visual tool, understanding the underlying logic helps in debugging. The flow can be conceptually represented as:
Start -> [Schedule Inspection - Main]
Schedule Inspection - Main -> {less than 1 week} -> Loop Back
Schedule Inspection - Main -> sd Interaction
sd Interaction -> Decision Node
Decision Node -- [Approved] --> [Print Report to Client]
Decision Node -- [Not Approved] --> [Finalize Inspection Report]
Finalize Inspection Report -> Loop Back to Schedule Inspection - Main
Why Use Interaction Overview Diagrams?
The primary advantage of this diagram type is Abstraction. By wrapping complex message exchanges inside a single box (the Interaction Node), you can focus on the system’s high-level logic without getting bogged down in the minutiae of every message sent.
This is particularly useful for:
- Breaking down massive interactions: As noted in the context, use this to break down a massive interaction into manageable chunks.
- Linking scenarios logically: It allows you to link different sequence diagrams together based on business rules or state changes.
- Visualizing Control Flow: It clearly shows loops, branching paths, and synchronization points (like the black bars used in standard Activity Diagrams).
Tooling and Implementation
For the best results in modeling these diagrams, ensure your modeling environment supports both Interaction Use and Control Flow. In the provided screenshot, we are using Visual Paradigm.
Visual Paradigm offers a robust library for these diagrams, allowing you to drag and drop Interaction, Interaction Use, and Decision Node elements directly onto the IOD canvas. This visual approach significantly reduces the cognitive load required to map out complex system behaviors.
By mastering the Interaction Overview Diagram, you transform a collection of disconnected sequence diagrams into a powerful, navigable map of your system’s behavior, ensuring that your architecture is both detailed and comprehensible.