


In the world of software engineering and system design, clarity is currency. When you need to communicate complex relationships between microservices, network nodes, or data flows, static images often fail to capture the dynamic nature of the system. This is where the Graphviz engine, integrated within the Visual Paradigm VPasCode tool, becomes an indispensable asset. By combining the power of Diagrams as Code with the robust DOT language, developers can create precise, maintainable, and version-controlled architectural diagrams.
This tutorial will guide you through the architecture of a typical client-server system using Graphviz. We will explore the underlying concepts of directed graphs, the syntax of the DOT language, and how to leverage VPasCode for efficient visual modeling.
The Power of the DOT Language
Graphviz is not just a drawing tool; it is a visualization engine that uses the DOT language to define the structure of a graph. Unlike drag-and-drop tools where layout is often manual and brittle, DOT relies on a declarative approach. You define the nodes (the entities) and the edges (the relationships), and the Graphviz engine automatically calculates the optimal layout.
The DOT language is particularly suited for:
- Dependency graphs: Visualizing how modules rely on one another.
- Network diagrams: Mapping out server connections and traffic flow.
- Organizational structures: Representing hierarchical reporting lines.
- Call graphs: Tracing the execution path of functions within an application.
Deconstructing the Architecture Model
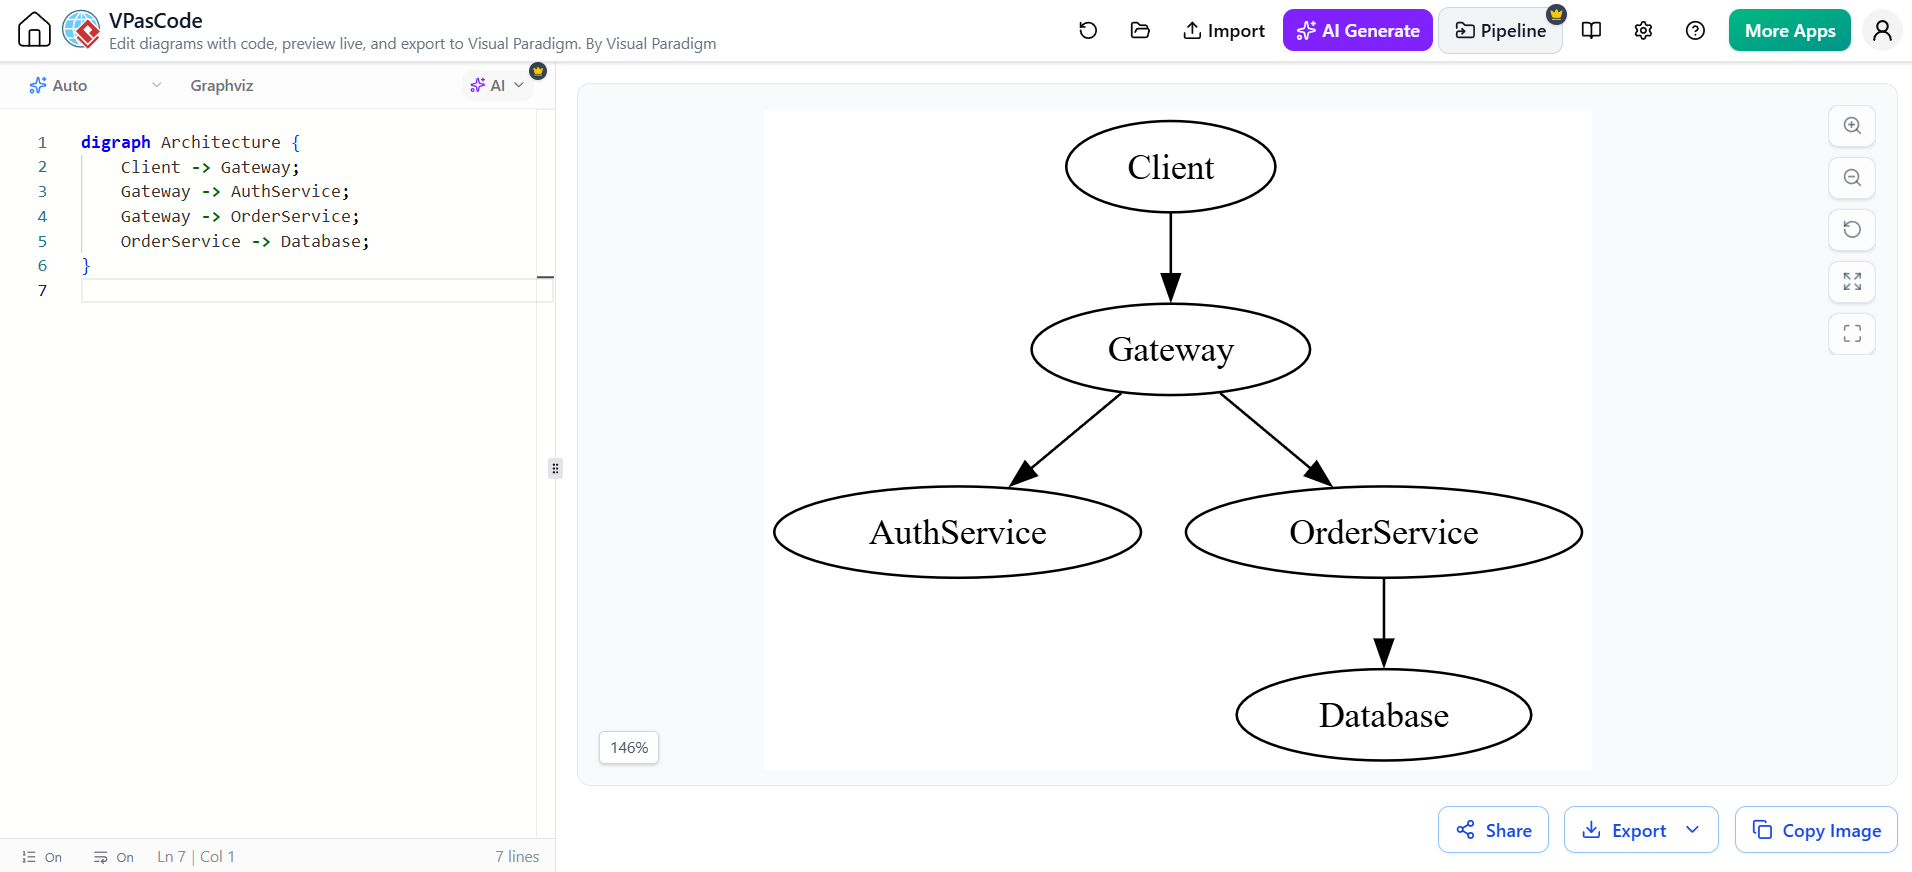
Let’s analyze a specific architectural scenario: a standard microservices architecture. In this model, a Client initiates a request, which is routed through a Gateway. The Gateway acts as a single entry point, delegating tasks to specific services like AuthService and OrderService. Finally, data persistence is handled by a Database.
Defining the Graph Structure
To represent this system in DOT, we begin by declaring the type of graph. Since our arrows indicate a specific flow (Client to Gateway, Gateway to Service), we use a directed graph, denoted by the digraph keyword. We then assign a name to the graph, such as Architecture.
The core logic of the diagram lies in the relationships defined between nodes. In the DOT language, a directed edge is created using the arrow operator ->. The syntax follows the pattern SourceNode -> TargetNode;.
digraph Architecture {
    Client -> Gateway;
    Gateway -> AuthService;
    Gateway -> OrderService;
    OrderService -> Database;
}
Here is a breakdown of the logic within this snippet:
Client -> Gateway;: This line establishes that the Client interacts with the Gateway. It implies the Gateway is the entry point for the Client.Gateway -> AuthService;andGateway -> OrderService;: These lines demonstrate branching logic. The Gateway does not just route to one service; it distributes traffic to both authentication and order management services.OrderService -> Database;: This represents the final dependency. The Order Service requires a data store to function, creating a directed flow from the service layer to the data layer.
Integrating with VPasCode
Visual Paradigm’s VPasCode tool bridges the gap between writing code and viewing visual diagrams. Instead of manually drawing shapes and aligning arrows, you simply type the DOT script into the editor pane.
- Input: Enter the
digraphdefinition into the code editor. - Preview: The engine instantly parses the code and renders the graph on the canvas. You will see the nodes (Client, Gateway, etc.) and the directed edges connecting them.
- Refinement: If you need to change the flow, simply edit the text. For example, changing
Client -> GatewaytoClient -> AuthServiceinstantly redraws the entire diagram to reflect the new topology.
This “Live Preview” capability allows architects to iterate rapidly. You can test different architectural patterns—such as switching from a monolithic gateway to a service mesh—by simply rewriting the relationship lines.
Best Practices for System Modeling
When modeling complex systems, consistency is key. Using a text-based approach like DOT enforces naming conventions. If you decide to rename a service from AuthService to AuthenticationService, you can perform a global find-and-replace in the code editor to update the node label and all references simultaneously. This eliminates the “broken link” errors common in graphical tools where nodes might be moved but arrows remain attached to the old coordinates.
Furthermore, because the diagram is stored as plain text, it can be version-controlled using Git. You can track how your system architecture evolves over time, seeing exactly which dependencies were added or removed in each commit. This transparency is invaluable for maintaining the health of large-scale distributed systems.
By mastering the DOT language and leveraging tools like VPasCode, you move beyond static documentation to create a living model of your system architecture that is as robust and flexible as the code it represents.