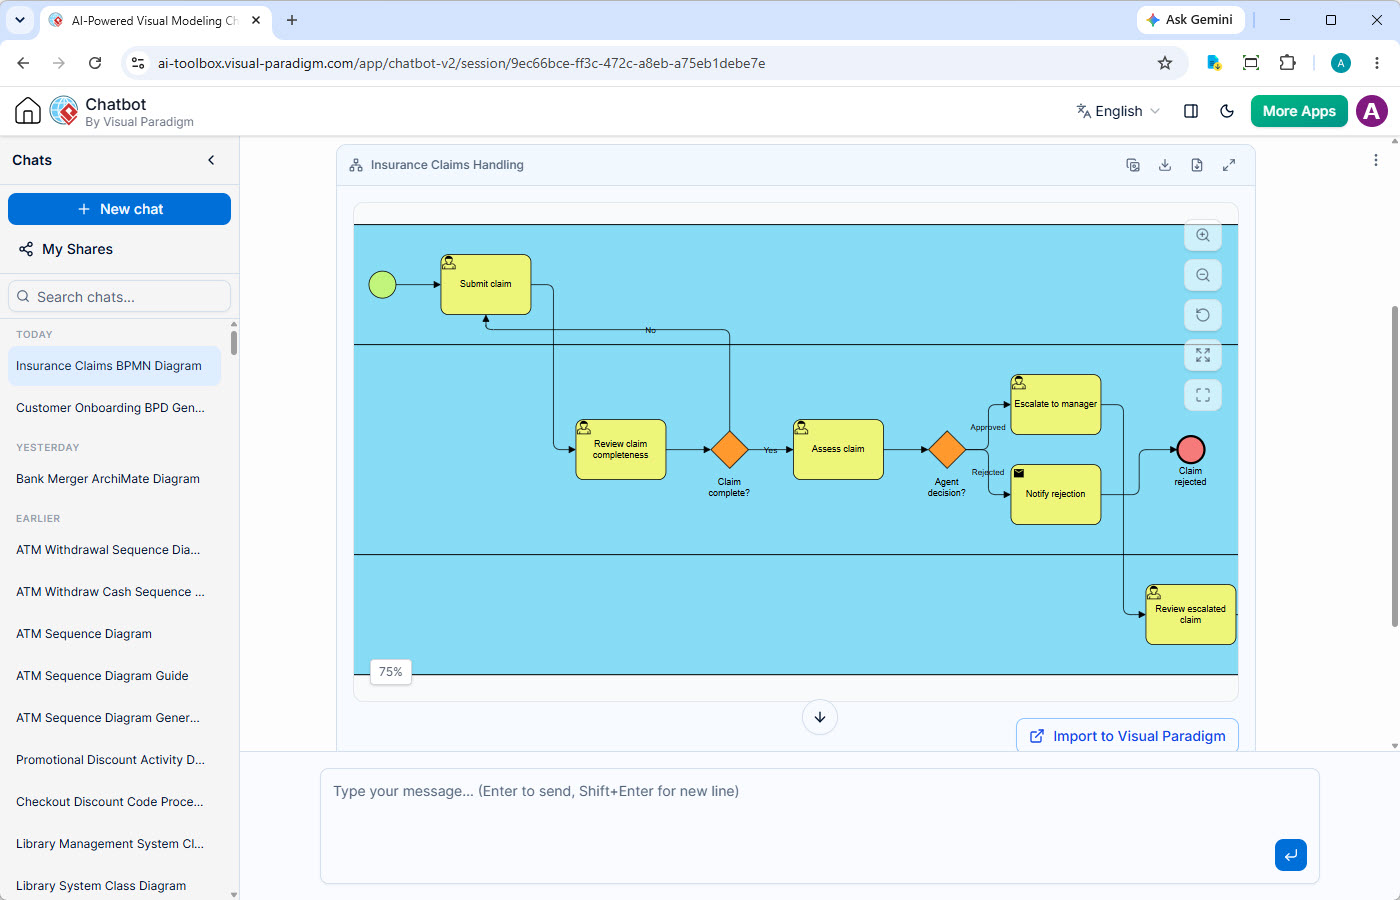
Welcome to this tutorial on modern business process modeling. In the visual example provided, we see a Business Process Model and Notation (BPMN) diagram titled “Insurance Claims Handling,” generated by an AI tool called Visual Paradigm. This diagram serves as a perfect case study for understanding how complex workflows can be visualized, analyzed, and automated using artificial intelligence.
Tracing the Process Flow
Let’s break down the flow, starting from the top left. The process begins with a green circle, known as the Start Event. This triggers the first task, “Submit claim,” indicated by a yellow rounded rectangle. The small user icon inside signifies that this action is performed by an external participant, likely the customer initiating the request.
Following the arrow downwards, we enter the internal processing lane. The first step is “Review claim completeness.” This leads to an orange diamond, a Gateway. In BPMN, diamonds represent decision points. Here, the question is “Claim complete?”. If the answer is “No,” a line loops back to the top, forcing the customer to resubmit. This is a vital error-checking loop that ensures data integrity before the claim is processed further.
If the answer is “Yes,” the flow moves to “Assess claim.” This is followed by another decision point: “Agent decision?”. This splits the process into two distinct paths. The “Rejected” path leads to “Notify rejection” and ends at a red circle, the End Event labeled “Claim rejected”. This clearly defines a termination state for the process.
Navigating Escalation and Hierarchy
The “Approved” path, however, is particularly interesting. It leads to “Escalate to manager.” This highlights a hierarchy in the process where standard approvals might not be sufficient for certain claims. The final visible task is “Review escalated claim,” showing that high-value or complex claims require a second level of human review. Although the diagram cuts off after this step, it implies a final resolution or payout phase follows the manager’s review.
Decoding the Symbols
For those new to process mapping, this image illustrates several key concepts:
- Tasks (Yellow Rectangles): These represent specific actions or work units, such as “Assess claim” or “Notify rejection.” The user icons indicate human involvement.
- Gateways (Orange Diamonds): These act as traffic controllers. They dictate where the process goes based on a condition, such as whether a claim is complete or if an agent approves it.
- Events (Green/Red Circles): The green circle marks the beginning, while the red circle marks a specific end state, in this case, a rejected claim.
This example demonstrates the power of AI in business analysis. By simply describing a process, the AI constructs a standard, readable diagram that instantly clarifies roles, responsibilities, and decision logic, saving analysts hours of manual drawing time.