


In the realm of project management, clarity is currency. When managing complex software development cycles—such as enhancing an online shopping platform—project managers need more than just a to-do list; they need a visual roadmap. This tutorial explores the Enhanced PERT (Program Evaluation and Review Technique) Chart, utilizing a real-world example of an online shop enhancement project. By understanding the architecture, swimlanes, and dependency flows shown below, you can master the art of scheduling and resource allocation.
What is an Enhanced PERT Chart?
A PERT chart is a project management tool used to schedule, organize, and coordinate tasks within a project. Unlike a simple Gantt chart, a PERT chart emphasizes the logical relationships between tasks. The “Enhanced” version typically includes granular details such as unique task IDs, precise start/end dates, and duration estimates, allowing for critical path analysis.
Anatomy of a PERT Task Node
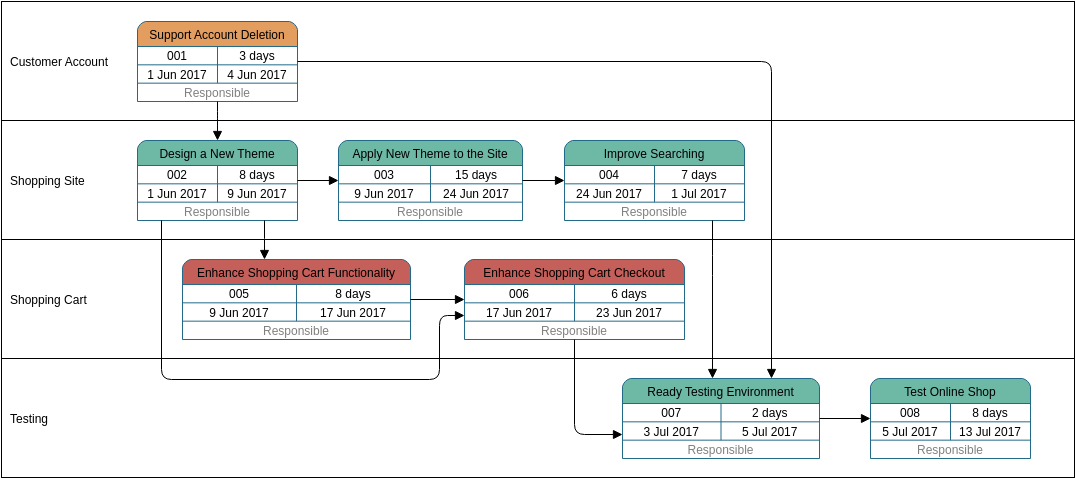
Every box in the diagram represents a specific work item. Let’s deconstruct the data contained within a standard node, using Task 002: Design a New Theme as our primary example:
- Task Title: “Design a New Theme” – A clear description of the deliverable.
- ID (002): A unique identifier used for tracking and referencing the task in reports or code.
- Duration (8 days): The estimated time required to complete the task.
- Timeline (1 Jun 2017 – 9 Jun 2017): The calculated start and finish dates based on the duration and project constraints.
- Responsible: A placeholder for the team member or role accountable for the completion of the task.
Navigating Swimlanes: Organizing by Domain
The chart is vertically divided into horizontal bands known as Swimlanes. This visual structure is crucial for large teams because it categorizes tasks by functional area or domain. In this “Enhanced Pert Chart for Task Management Automation,” we see four distinct domains:
- Customer Account: The top lane handles backend administrative tasks, such as Support Account Deletion. This suggests that account maintenance is a prerequisite or parallel task to the main development work.
- Shopping Site: This lane focuses on the frontend design and user experience, including Design a New Theme, Apply New Theme to the Site, and Improve Searching.
- Shopping Cart: This lane handles the core transactional logic. It includes Enhance Shopping Cart Functionality and Enhance Shopping Cart Checkout.
- Testing: The final lane ensures quality assurance (QA) before deployment, covering Ready Testing Environment and Test Online Shop.
Understanding Dependencies and Flow
The arrows connecting the boxes are the most critical part of the diagram. They represent dependencies—the rules that dictate the order of operations. You cannot start a task until its predecessor is finished. Let’s trace the workflow logic:
1. The Sequential Design Flow
In the Shopping Site lane, the flow is strictly linear. You must Design a New Theme (002) before you can Apply it to the Site (003), which in turn must happen before you can Improve Searching (004). This is a classic serial dependency.
2. Parallel Development (Concurrency)
Notice how the Shopping Site and Shopping Cart lanes interact. The arrow originating from Design a New Theme (002) points down to Enhance Shopping Cart Functionality (005). This indicates that while the design team is working on the site theme, the cart developers can begin their work, provided the initial design is stable. This concurrency saves time.
3. The Convergence Point
The chart demonstrates a “convergence” before the final testing phase. The Ready Testing Environment (007) task has two incoming arrows: one from Enhance Shopping Cart Checkout (006) and one from Improve Searching (004). This means the testing environment cannot be prepared until both the cart checkout and the search improvements are complete. This is a critical synchronization point in project management.
Practical Application: Calculating the Critical Path
By analyzing the durations and dates, a project manager can identify the Critical Path—the longest sequence of tasks that determines the shortest possible time to complete the project.
In this diagram, the project starts on 1 Jun 2017. The final task, Test Online Shop (008), ends on 13 Jul 2017. Any delay in Task 004 or Task 006 will directly delay the final launch date. Understanding this allows managers to allocate more resources to high-risk tasks to prevent bottlenecks.
Conclusion
The Enhanced PERT Chart is not just a drawing; it is a dynamic planning tool. By visualizing the Shopping Site and Shopping Cart workflows alongside Testing requirements, stakeholders gain a holistic view of the project timeline. Whether you are using tools like Visual Paradigm or drawing by hand, mastering this structure is essential for successful task management automation.
Related posts:
 Mastering Project Scheduling: An In-Depth Guide to PERT Charts and Network Diagrams
 Mastering Project Scheduling: A Comprehensive Guide to Enhanced PERT Charts in Visual Paradigm
 Mastering Project Management: Integrating RACI Models into PERT Charts with Visual Paradigm
 From PERT Charts to Action: Mastering Task Synchronization in Visual Paradigm