


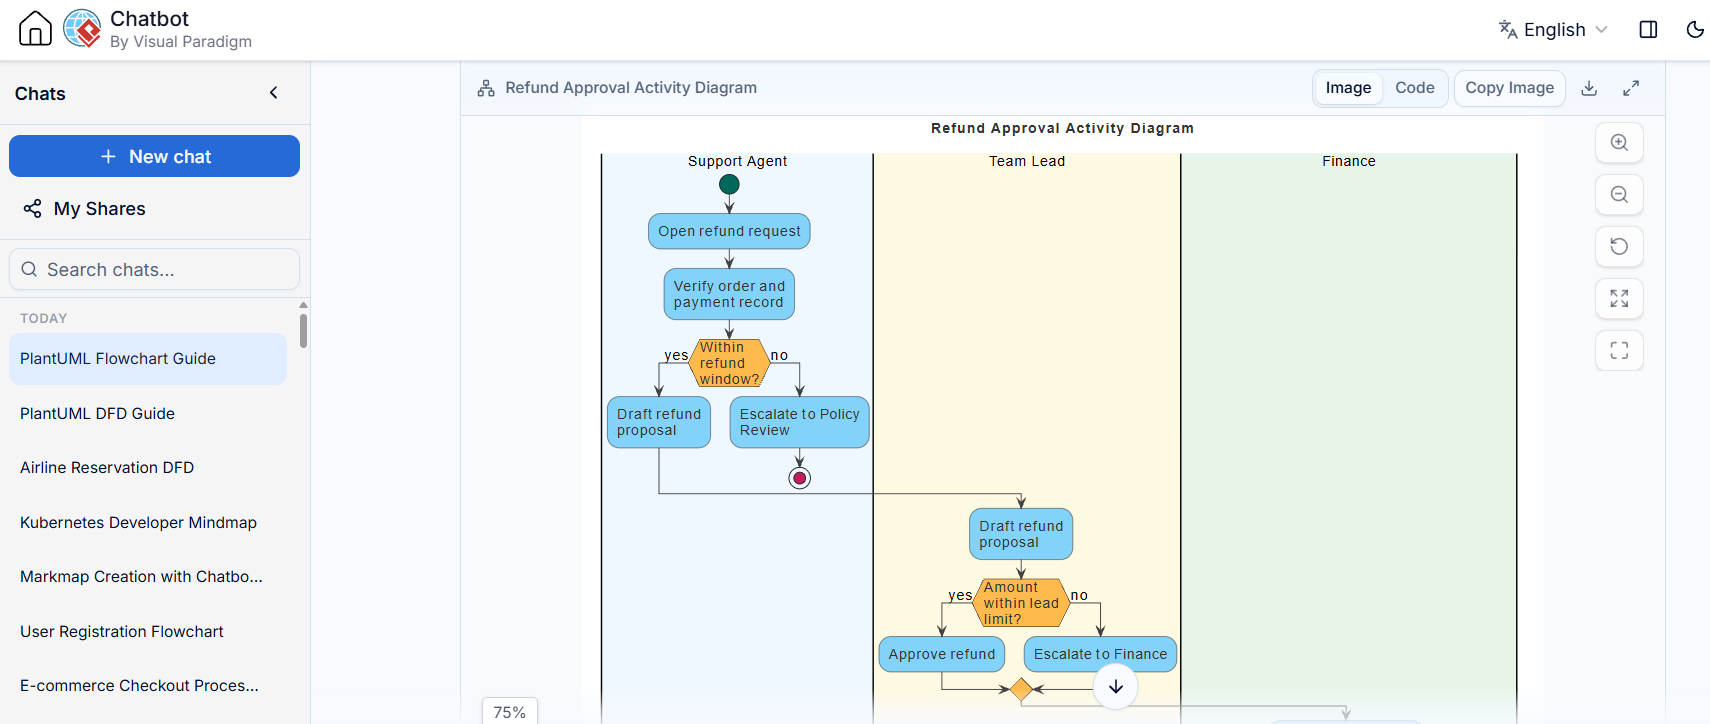
In the world of system analysis and business process modeling, few diagrams are as critical as the Activity Diagram. It serves as the blueprint for how a specific workflow moves from initiation to completion. Today, we will dissect a real-world example: the Refund Approval Process. This tutorial will guide you through the structure of this diagram, explaining the roles of the actors, the logic of the decisions, and the power of using “swimlanes” to clarify responsibility.
Understanding the Core Components
An Activity Diagram is essentially a flowchart enhanced with specific UML (Unified Modeling Language) notations. However, to make it truly useful for a complex system, we must organize it. The diagram shown in the interface utilizes a technique called Swimlanes.
1. The Power of Swimlanes
Notice the vertical columns in the diagram: Support Agent, Team Lead, and Finance. These are the swimlanes. They represent the organizational hierarchy or the different actors involved in the process.
- Support Agent: The entry point. They handle the initial intake of a request.
- Team Lead: The decision maker. They manage exceptions, policy reviews, and approvals based on thresholds.
- Finance: The final authority. They handle large-scale financial transactions that exceed standard limits.
The key benefit here is disambiguation. By restricting actions to specific lanes, the diagram immediately answers the question: “Who does what?”
Step-by-Step Walkthrough of the Workflow
Let’s trace the path of a single refund request through the system, starting from the top.
Phase 1: Initiation and Verification
The process begins at the Support Agent lane. The lifecycle starts with a solid black circle (the initial node), leading to the action: Open refund request. The agent then performs a critical verification step: Verify order and payment record.
Phase 2: The First Decision (The Window)
Immediately after verification, the flow hits a decision node—a diamond shape (or hexagon in this specific style). The condition is: Within refund window?.
- Yes: The process moves to Draft refund proposal.
- No: The process diverts to Escalate to Policy Review.
Crucially, these paths eventually merge back together. The “No” path leads to a decision point where the Team Lead must step in, merging the flow back into the main approval track.
Phase 3: The Escalation to Team Lead
Once the draft is prepared (either directly or via policy review), the control flow passes from the Support Agent to the Team Lead. This is represented by the arrow crossing the vertical boundary line. The Team Lead receives the Draft refund proposal.
Phase 4: The Second Decision (The Threshold)
The Team Lead faces a new decision node: Amount within lead limit?. This is the financial gatekeeper.
- Yes: The Team Lead has the authority to Approve refund.
- No: The request is too large for the Lead. It is Escalate to Finance.
The diagram shows the flow moving from the Team Lead’s yellow lane into the Finance lane (the green area), indicating a significant handoff of responsibility.
Technical Modeling Concepts
When building diagrams like this in tools such as Visual Paradigm, several technical concepts are at play:
Object Flow vs. Control Flow
In a strict UML Activity Diagram, you differentiate between the flow of control (the arrows showing order of execution) and the flow of objects (the data or physical items moving between steps). In this diagram, the arrows primarily represent control flow—indicating that once step A is done, step B can begin.
Fork and Join Nodes
Look at the bottom of the Team Lead lane and the transition to Finance. You will see a thick bar. This is a Fork or Join node. In this context, it acts as a Join node, bringing the “Approve” path and the “Escalate” path back together before the process terminates or continues. It ensures that all possible paths converge to a single, defined next step.
Termination
The process ends with a red circle inside a black ring (the final node). This signifies that the workflow is complete—either the refund is approved and processed, or the request has been escalated to the highest authority.
Conclusion
This Activity Diagram is a perfect example of how to model complex business logic without clutter. By using swimlanes to separate the Support Agent, Team Lead, and Finance, we create a visual contract that defines exactly where authority lies and how exceptions are handled. Whether you are drawing this by hand or using a tool like Visual Paradigm, the underlying logic remains the same: clarity of process is the key to operational success.