


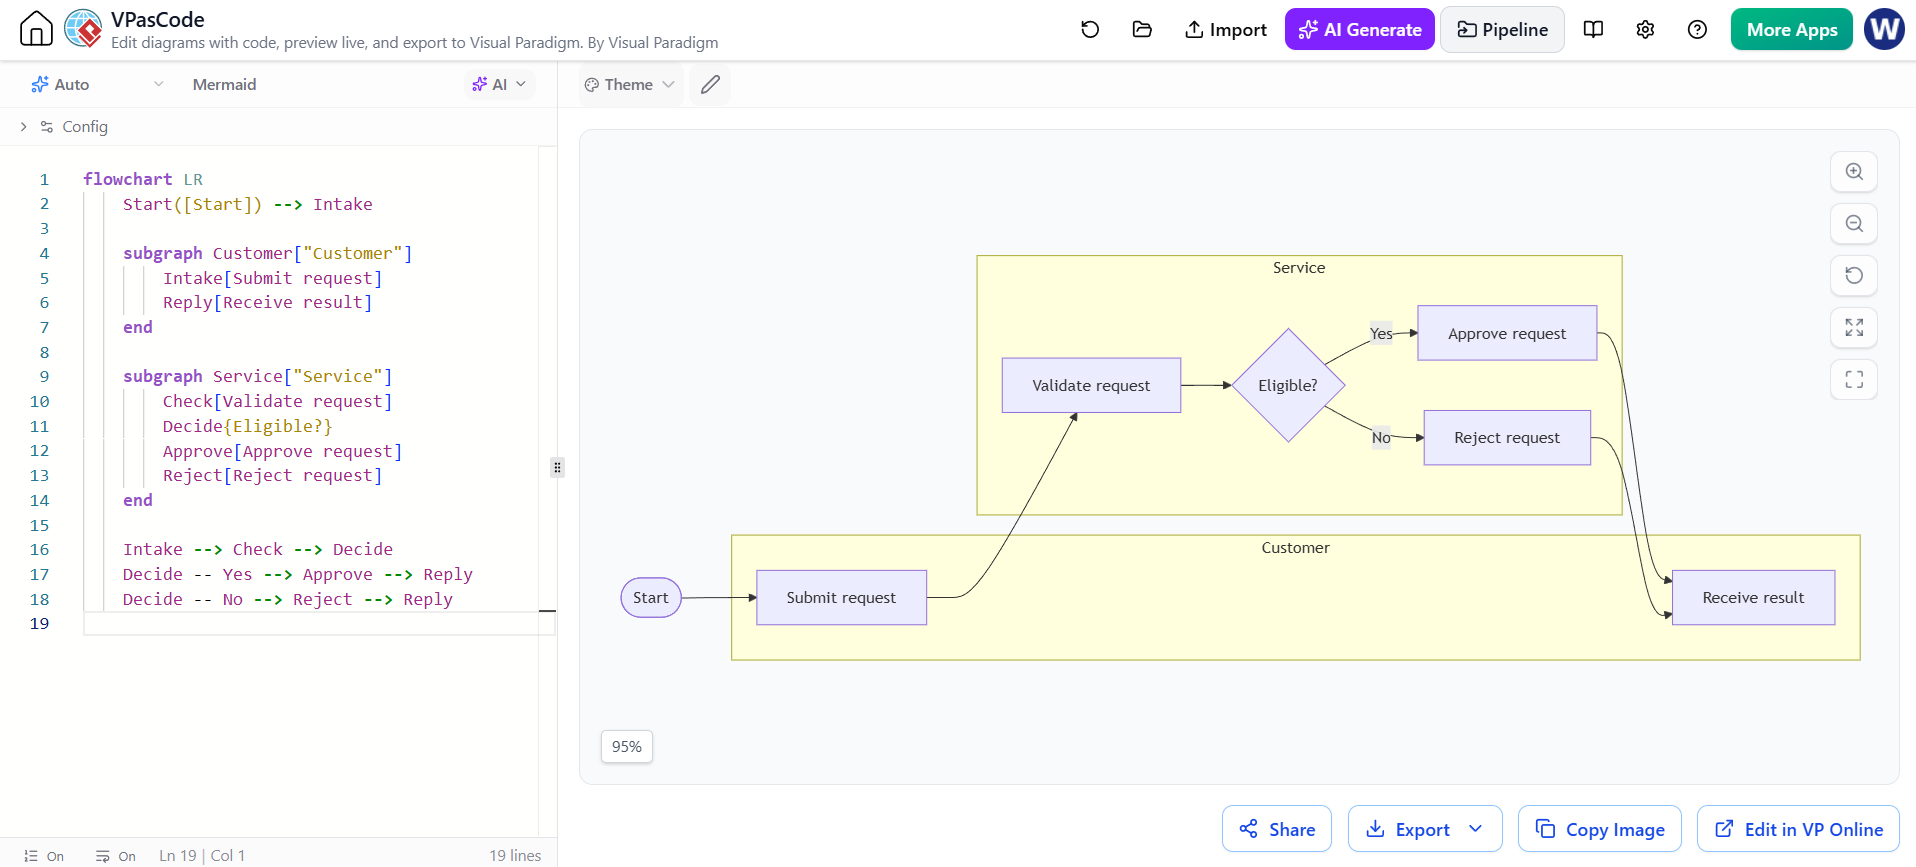
In the realm of system architecture and business process modeling, clarity is paramount. When explaining how a service interacts with its users, you need more than just a list of steps; you need a visual representation of boundaries. Visual Paradigm’s VPasCode Editor empowers architects to define these boundaries using the power of text-to-diagram generation, specifically leveraging subgraphs.
This tutorial will guide you through the logic of creating a robust system context diagram using Mermaid syntax. We will analyze the provided flowchart, which maps a customer request lifecycle, and explore how grouping nodes into subgraphs transforms a flat list of actions into a meaningful architectural narrative.
The Power of Subgraphs in System Modeling
At its core, a subgraph in diagramming serves the purpose of encapsulation. It allows you to visually group related nodes—such as steps owned by a particular team, a specific system component, or a distinct phase of a project. In the context of the “Customer vs. Service” diagram provided, subgraphs are the mechanism used to separate the Customer’s perspective from the Service’s internal logic.
Without subgraphs, a flowchart can look like a chaotic web of arrows. By introducing subgraphs, you create “swimlanes” that dictate context. This is essential for high-level architecture diagrams where you need to show what happens “inside” the system versus what happens “outside” with the user.
Analyzing the Architecture: The Request Lifecycle
Let’s break down the logic of the provided Mermaid code. The diagram represents a standard business process: a user submits a request, and the system processes it based on eligibility rules.
1. Defining the Flow Direction
The diagram begins with the direction declaration flowchart LR. This tells the rendering engine to draw the graph from Left to Right. This is generally preferred for Western reading patterns and simplifies the mental map of the process flow.
2. The Start Node
The process initiates with a terminal node:
Start([Start]) --> IntakeHere, Start is defined with the shape ([Start]), indicating a rounded terminal shape. It connects directly to the Intake node.
3. Grouping the Customer Domain
The first logical grouping is the Customer. This subgraph represents the external entities or the user interface layer. It contains the entry and exit points of the system.
subgraph Customer["Customer"]
    Intake[Submit request]
    Reply[Receive result]
end- Intake: The action where the customer “Submit request.”
- Reply: The action where the customer “Receive result.”
By placing these inside the Customer subgraph, we visually assert that these steps are the customer’s responsibility or view, not the system’s internal processing.
4. Grouping the Service Domain
The second, and most complex, grouping is the Service. This represents the internal backend logic.
subgraph Service["Service"]
    Check[Validate request]
    Decide{Eligible?}
    Approve[Approve request]
    Reject[Reject request]
end
This block contains the “heavy lifting” of the process:
- Check: The system performs a validation check.
- Decide: A diamond shape (
{...}) indicates a decision point. The question is “Eligible?”. - Approve/Reject: These are the two possible outcomes of the decision.
Connecting the Logic: Data Flow
Once the groups are defined, we must define the relationships. The arrows in Mermaid define the flow of control or data. The code explicitly connects the Customer’s actions to the Service’s actions and vice versa.
The Entry Path
The customer initiates the request, which triggers the service to validate it:
Intake --> Check --> DecideThis single line of code creates a chain: Intake points to Check, which points to Decide.
The Decision Branching
The logic then splits based on the outcome of the Decide node. The syntax -- Yes --> allows us to label the arrows, making the diagram self-documenting.
Decide -- Yes --> Approve --> Reply
Decide -- No --> Reject --> Reply
This establishes two distinct paths:
- Success Path: If eligible (Yes), the system approves the request, and the customer receives the result.
- Failure Path: If not eligible (No), the system rejects the request, and the customer still receives the result (likely an error message).
Visualizing the Interaction
The final output visually demonstrates a cross-boundary flow. Notice how the arrows cross from the “Customer” box to the “Service” box and back. This is the critical value of the diagram: it explicitly maps the handover of information between the user and the system.
Best Practices for Contextual Diagrams
While the code provided is functional, effective system modeling requires discipline. The prompt notes: “Too many groups can make a diagram harder to follow, especially when arrows cross between them.”
When designing your own diagrams:
- Minimize Crossing Arrows: If you find yourself drawing lines that zigzag wildly between boxes, consider if your grouping logic is sound. Try to arrange subgraphs so that the flow is natural (e.g., Top-to-Bottom or Left-to-Right).
- Meaningful Labels: Ensure the subgraph labels (like “Customer” and “Service”) add semantic meaning. Don’t just group nodes by color; group them by function or domain.
- Use Shapes to Indicate Types: Use
[]for processes,()for terminals, and{}for decisions. This visual consistency helps readers parse the diagram instantly.
Conclusion
By mastering the syntax of subgraphs in VPasCode, you can rapidly prototype complex system architectures. The transition from a flat list of steps to a grouped, context-aware diagram is a significant leap in communication quality. Whether you are documenting a legacy system or planning a new microservice architecture, the ability to visually separate the “Customer” from the “Service” is a fundamental skill for any technical architect.