


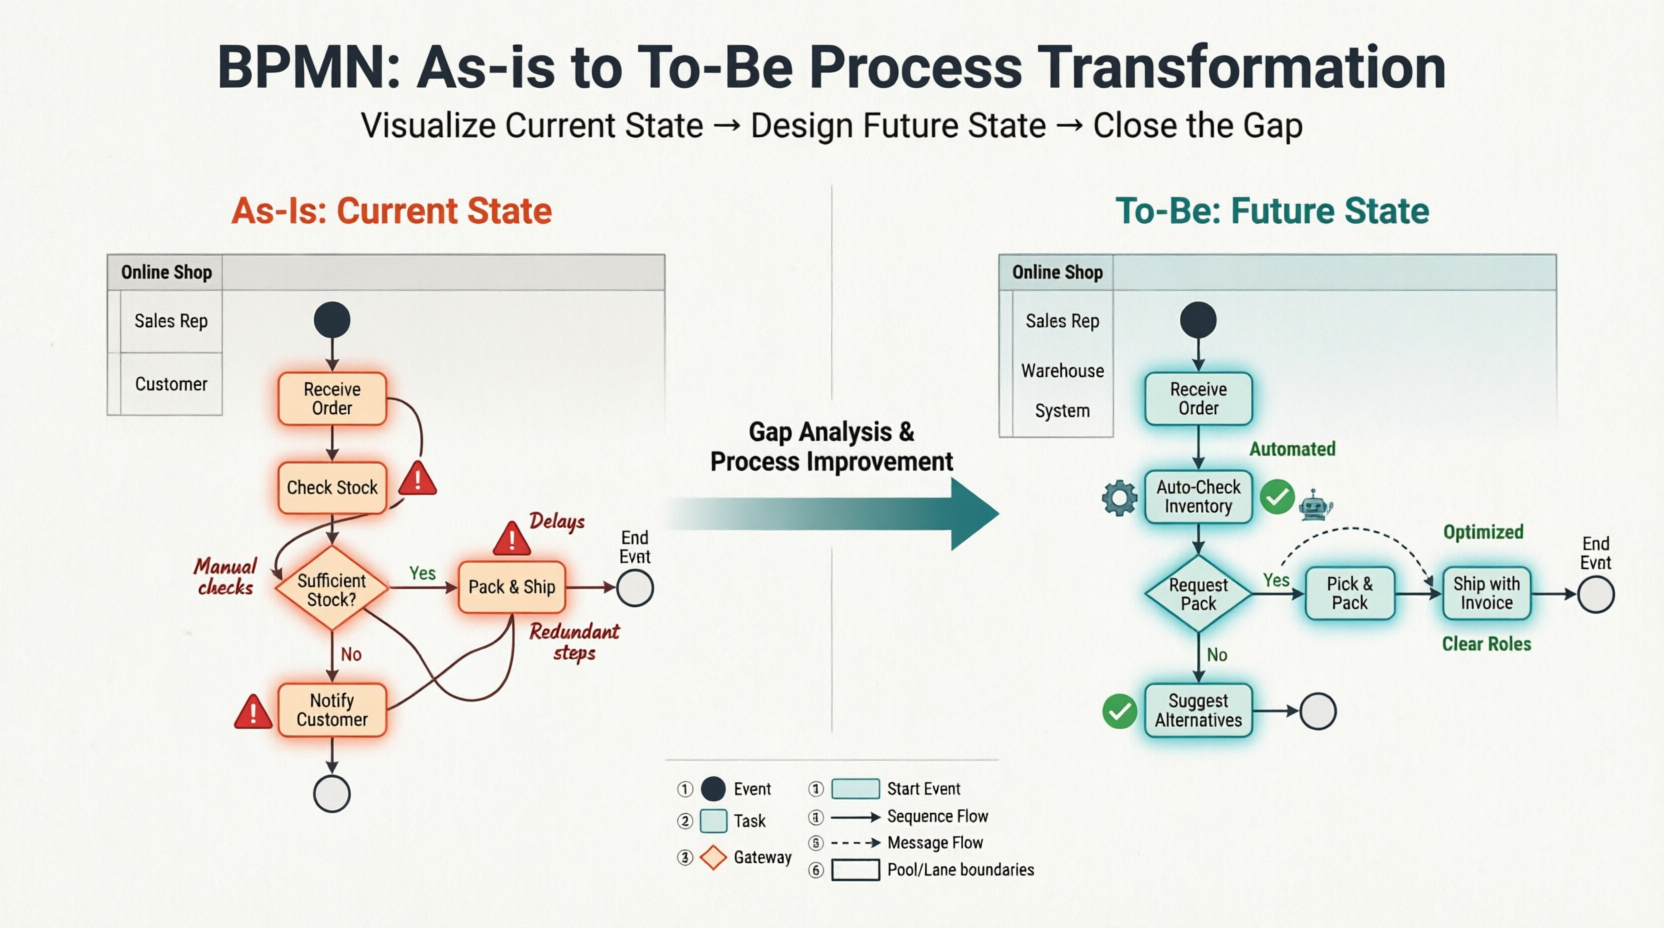
In the realm of Business Process Management (BPM), the journey from identifying inefficiencies to implementing solutions is often the most critical phase. This process is frequently visualized through a transformation from an As-Is state (current reality) to a To-Be state (future optimization). However, simply drawing two different diagrams is not enough; you must rigorously validate that your new model actually solves the problems identified in the old one.
This tutorial explores the technical methodology of comparing process models using the Visual Diff feature in Visual Paradigm. We will analyze the structural differences between a manual, error-prone order process and its automated future state, demonstrating how to use tooling to ensure operational integrity.
Understanding the Architecture of Process Transformation
The core concept behind this workflow is Gap Analysis. When an organization decides to improve a process, they often face a complex challenge: ensuring that the new design removes bottlenecks without breaking existing logic.
In the provided architecture, we observe a classic transformation scenario:
- The As-Is Model (Current State): This model represents the legacy process. In our example, it is characterized by manual interventions, “siloed” roles (Sales Rep, Customer), and reactive decision-making. The flow is often convoluted, featuring “redundant steps” and manual checks.
- The To-Be Model (Future State): This model represents the target state. It introduces automation, clear role definitions (Warehouse, System), and streamlined logic. The goal is to reduce latency and human error.
The transition between these two states requires a systematic approach to ensure that the “To-Be” model is not just a theoretical drawing, but a functional blueprint.
The Visual Diff Workflow in Visual Paradigm
Visual Paradigm provides a dedicated tool called Visual Diff to handle the comparison of these models. This tool abstracts the complex mathematical comparisons of graph theory into a user-friendly visual interface.
Step 1: Accessing the Tool
To begin the analysis, navigate to the Modeling menu within the Visual Paradigm interface. Select the Visual Diff option. This tool is specifically designed to load two model files (the As-Is and To-Be BPMN diagrams) and render them side-by-side or in a unified comparison view.
Step 2: Configuring the Strategy
Once the models are loaded, the configuration strategy is paramount. For this specific transformation analysis, the strategy must be set to Transitor.
Why Transitor?
The Transitor strategy is superior for process transformation because it does not merely compare static elements. It tracks element-level transitions and structural changes. This allows the system to understand the “story” of the process—identifying what was removed, what was added, and how the flow has been re-routed.
Analyzing the Gap: As-Is vs. To-Be
Upon running the Visual Diff with the Transitor strategy, the system highlights specific differences. These differences fall into three distinct categories that must be analyzed to validate the transformation.
1. Additions (New Capabilities)
In the transformation from the manual “As-Is” to the automated “To-Be” state, we observe the addition of new elements:
- Automated Tasks: The “Auto-Check Inventory” task replaces the manual “Check Stock” step. This is a critical addition that introduces system logic.
- New Roles: The “Warehouse” and “System” roles appear in the To-Be model, indicating a shift in responsibility from the Sales Rep to the backend logistics system.
- Optimized Flows: The “Suggest Alternatives” task is added to handle the “No” branch of the decision gateway, turning a dead-end into a service opportunity.
2. Deletions (Removing Bloat)
Process improvement often involves subtraction. The Visual Diff tool highlights the removal of:
- Redundant Steps: The manual “Notify Customer” step for stock issues in the old flow is removed, likely replaced by the automated system or a more efficient notification trigger.
- Manual Checks: The “Check Stock” manual task is deleted, as it has been superseded by the automated logic.
3. Modifications (Refining Logic)
Some elements remain but undergo significant modification:
- Gateway Logic: The decision gateway “Sufficient Stock?” in the As-Is model is modified to “Request Pack” in the To-Be model. This reflects a shift from checking inventory availability to initiating a fulfillment request.
- Sequence Flows: The flow is restructured. For instance, the “Pack & Ship” step in the old model is reorganized into “Pick & Pack” and “Ship with Invoice” in the new model, clarifying the sequence of operations.
Ensuring Operational Integrity
The ultimate goal of using Visual Diff is to validate that the To-Be model effectively closes the operational gap. By reviewing the highlighted differences, stakeholders can confirm that:
- All identified bottlenecks (like “Delays” or “Manual checks”) have been addressed by specific additions or modifications.
- No critical business logic has been accidentally deleted during the redesign.
- The new roles and automated tasks align with the organization’s resources.
If the Visual Diff output reveals gaps—such as a task in the To-Be model that has no corresponding entry in the As-Is model, or a critical deletion that breaks a compliance requirement—this is a signal to iterate on the design before implementation.
Conclusion
Transforming a process is an exercise in precision. By leveraging the Visual Diff tool in Visual Paradigm with the Transitor strategy, analysts can move beyond simple diagramming and perform a rigorous audit of their process improvements. This ensures that the “To-Be” state is not just a vision, but a validated, executable roadmap for business success.