


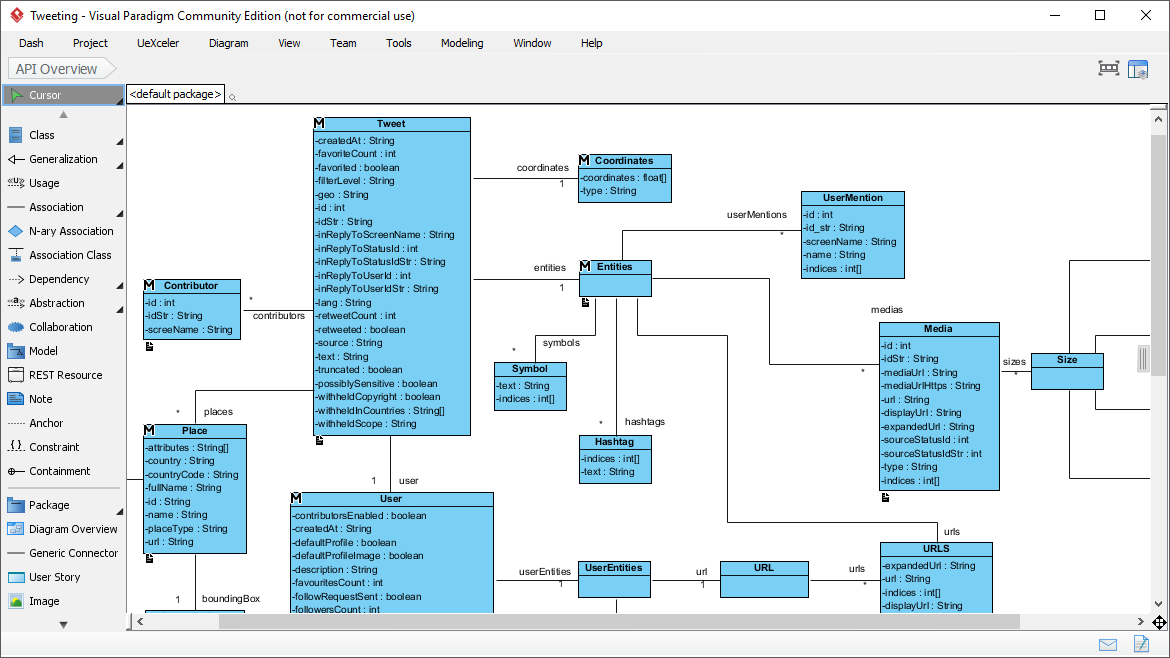
In the world of software engineering, the ability to visualize complex data structures is paramount. This tutorial focuses on the provided screenshot from Visual Paradigm, a powerful modeling tool used to design Class Diagrams. The image displays a sophisticated model representing the data structure of a social media entity, specifically a “Tweet,” and its relationship with users, locations, and media.
Class Diagrams are the backbone of Object-Oriented Design (OOD). They serve as the blueprint for your code, defining the static structure of the system. By understanding how to read and construct these diagrams, you can ensure your application is robust, scalable, and maintainable.
Understanding the Core Components
Before diving into the specific relationships shown in the diagram, it is essential to understand the building blocks of a UML Class Diagram. Every class typically consists of three compartments:
- Class Name: The top section (e.g.,
Tweet,User) identifies the entity. - Attributes: The middle section lists the data members or properties. In the screenshot, you can see attributes like
createdAt: Stringorid: int. The minus sign (-) preceding an attribute indicates Private visibility, meaning it is accessible only within the class itself. - Operations: The bottom section (though not heavily utilized in this specific view) would contain methods or functions that the class can perform.
The screenshot also features a specialized “Modeling Palette” on the left side. This is a key feature of Visual Paradigm, allowing users to drag and drop elements like Class, Association, and Dependency directly onto the canvas to build the diagram.
Decoding the Tweet Structure
The central entity in this diagram is the Tweet class. This represents a single post on the social platform. Let’s break down its attributes based on the visual data:
- Basic Metadata:
createdAt,favoriteCount, andidprovide the timestamp and unique identifier for the post. - Relationships: Attributes like
inReplyToScreenNameandinReplyToStatusIdindicate how this tweet relates to previous tweets, facilitating threaded conversations. - Content: The
textattribute holds the actual message, whilelangspecifies the language. - Flags: Boolean attributes like
truncated,possiblySensitive, andwithheldInCopyrighthelp manage content moderation and display logic.
Navigating Relationships and Associations
Perhaps the most critical part of this diagram is the network of lines connecting the classes. These lines represent Associations. In Visual Paradigm, these are the standard connectors used to show how objects interact.
1. The User and Contributor Relationship
The diagram shows a connection between Tweet and Contributor. The line is labeled “contributors,” and the cardinality is marked with an asterisk () on the contributor side. This notation implies a One-to-Many relationship (or rather, a Many-to-One depending on the perspective): One Tweet can have multiple contributors, or a contributor can write multiple tweets. The id and idStr attributes in the Contributor class act as foreign keys to link back to the user.
2. Geolocation: The Place Entity
The Place class is connected to Tweet via the “places” association. This represents the geolocation data. The “boundingBox” association between Place and Coordinates is particularly interesting. It suggests that a specific place is defined by a set of coordinates, likely creating a polygon to define the area of a city or region.
3. Entities: Hashtags, Mentions, and URLs
The Tweet class has a complex relationship with an Entities class. This is a common design pattern used to normalize data. Instead of cluttering the main Tweet class with lists of hashtags or URLs, they are grouped into an Entities object. This object then branches out into specific types:
- Hashtags: Represents words starting with
#. - UserMentions: Represents mentions of other users (e.g.,
@username). - URLs: Represents links included in the tweet.
- Media: Represents images or videos attached to the tweet.
Advanced Modeling: The Media and Size Relationship
Look closely at the Media class. It connects to a class simply labeled Size. This is a great example of modeling an object’s properties. The Media class stores information about the file (like mediaUrl and type), while the Size class (or association) handles the specific dimensions (width, height) or different resolutions available for that media asset.
Best Practices for Visual Paradigm Users
When working within Visual Paradigm, as shown in the screenshot, you should utilize the built-in features to maintain code quality:
- Use the Palette: Don’t just draw lines. Use the “Association” tool from the palette to ensure your relationships are semantically correct.
- Check Cardinalities: Always define the multiplicity (e.g., 1, , 0..1) on your lines. This tells the developer exactly how many instances can be linked.
- Generate Code: One of the superpowers of Visual Paradigm is “Forward Engineering.” Once you design a diagram like this, you can generate the actual Java, C#, or Python classes automatically, complete with the attributes and methods you’ve modeled.
Conclusion
The diagram displayed is a classic example of a well-structured Domain Model. It captures the essence of a social media post without getting bogged down in implementation details. By mastering these concepts in Visual Paradigm, you can move from abstract ideas to concrete, coded solutions with confidence. Whether you are designing a new app or refactoring an existing one, the Class Diagram is your most trusted guide.