


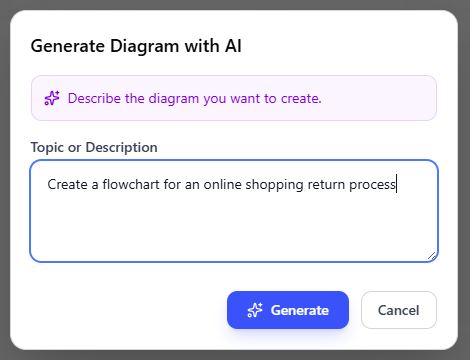
In the modern landscape of technical documentation and business process modeling, the barrier to entry for creating professional diagrams is rapidly dissolving. The image presented above highlights a pivotal feature in OpenDocs: the “Generate Diagram with AI” interface. This tool represents a shift from manual node-and-line construction to Generative Modeling, where the user provides a semantic description of a process, and the system renders the visual logic.
This tutorial delves into the architecture behind this interaction, explaining how natural language inputs are translated into structured diagrams. We will explore the workflow, the underlying logic of the “Create a flowchart for an online shopping return process” example, and the technical specifications required to model complex business scenarios.
The Architecture of AI-Driven Diagramming
At its core, the system architecture supporting the interface shown in the screenshot operates on a Human-in-the-Loop (HITL) model. It does not merely guess; it interprets intent. The process generally follows these architectural layers:
- Input Layer: The user enters a prompt into the
Topic or Descriptiontext area. This acts as the “Prompt” in a Large Language Model (LLM) context window. - Intent Recognition: The system parses the text to identify the type of diagram (e.g., Flowchart, BPMN, UML Sequence) and the entities involved (e.g., “Customer”, “System”, “Warehouse”).
- Logic Generation: The AI constructs a logical sequence of events. For the example “online shopping return process,” it deduces a linear flow with decision points (e.g., “Is item eligible?”).
- Rendering Engine: Finally, the generated logic is compiled into a visual format (SVG, Canvas, or Mermaid code) and displayed to the user.
Understanding the Input Prompt
The effectiveness of this system relies heavily on the quality of the input provided in the text box. The system is designed to accept natural language descriptions, but for optimal results, the input should be structured around specific modeling concepts.
Consider the example text in the image:
Create a flowchart for an online shopping return processThis is a robust prompt because it contains two critical directives:
- Diagram Type: “Create a flowchart” explicitly tells the engine to use flowchart notation (rectangles for processes, diamonds for decisions).
- Domain Context: “online shopping return process” provides the semantic context needed to generate relevant steps.
Step-by-Step: Modeling the Return Process
Let us walk through what happens logically when the user clicks the Generate button. The AI must translate the abstract concept of a “return process” into a concrete algorithmic structure.
1. Identifying Actors and Entities
Before drawing lines, the system identifies the actors involved in the scenario:
- Customer: The initiator of the return.
- Customer Support / System: The entity verifying the return.
- Warehouse: The physical location receiving the item.
2. Defining the Logic Flow
The AI constructs the sequence. A standard flowchart for this scenario typically looks like this logic:
- Start: Customer initiates return request.
- Process: System checks return policy.
- Decision: Is the item eligible?
- Branch A (Yes): Generate shipping label -> Customer ships item -> Warehouse receives -> Refund issued.
- Branch B (No): Notify customer of rejection.
- End: Process complete.
From Natural Language to Pseudocode
To understand the technical depth, we can visualize how the AI might convert the user’s text into internal pseudocode before rendering the final graphic. This logic ensures that the diagram is not just visually appealing but logically sound.
FUNCTION generateReturnFlowchart() {
    // Step 1: Define Start Node
    StartNode = "Customer Requests Return";

    // Step 2: Define Decision Logic
    DecisionNode = "Is Return Eligible?";

    // Step 3: Define Actions based on Decision
    IF (DecisionNode == TRUE) {
        ActionNode = "Issue Return Label";
        ActionNode = "Receive Item at Warehouse";
        EndNode = "Process Refund";
    } ELSE {
        ActionNode = "Send Rejection Notification";
        EndNode = "Close Case";
    }

    // Step 4: Render Flowchart
    RENDER_DIAGRAM(StartNode -> DecisionNode -> (TRUE/TRUE_BRANCH | FALSE/FALSE_BRANCH));
}
Best Practices for AI Diagramming
When utilizing the OpenDocs AI interface, adhering to specific guidelines ensures the generated output meets professional standards. Precision in your prompt is the single most important factor.
Advanced Prompting Techniques
To get the most out of the “Generate” feature, move beyond simple descriptions. Try including specific constraints or actors in your text input:
- Specify the Audience: “Create a flowchart for an online shopping return process for non-technical customers.” (This prompts the AI to use simpler terminology).
- Define the Scope: “Create a flowchart for an online shopping return process, including the warehouse inspection step.” (This ensures the logic doesn’t stop at the refund notification).
Conclusion
The interface shown in the screenshot represents the democratization of systems analysis. By allowing users to describe scenarios in natural language, tools like OpenDocs allow you to focus on the what and why of your business processes, while the AI handles the how of diagrammatic representation. Whether you are documenting an employee onboarding procedure or a complex supply chain return, the ability to generate diagrams from a simple text box accelerates the documentation lifecycle significantly.