DFD

Mastering Data Flow Diagrams: A Practical Guide

Mastering Data Flow Diagrams: A Practical Guide

Create clear and professional Yourdon DeMarco DFD in minutes
Visual Paradigm’s DFD tool features a rich set of editing features that makes diagramming simple and fast. The DFD tool supports various DFD notations, including Yourdon DeMarco and others. You can find all the symbols you need to create different kinds of DFDs. The editing features such as drag-and-drop and alignment guide make editing smooth and intuitive.
Mapping Data Flows in Order Processing

Mapping Data Flows in Order Processing

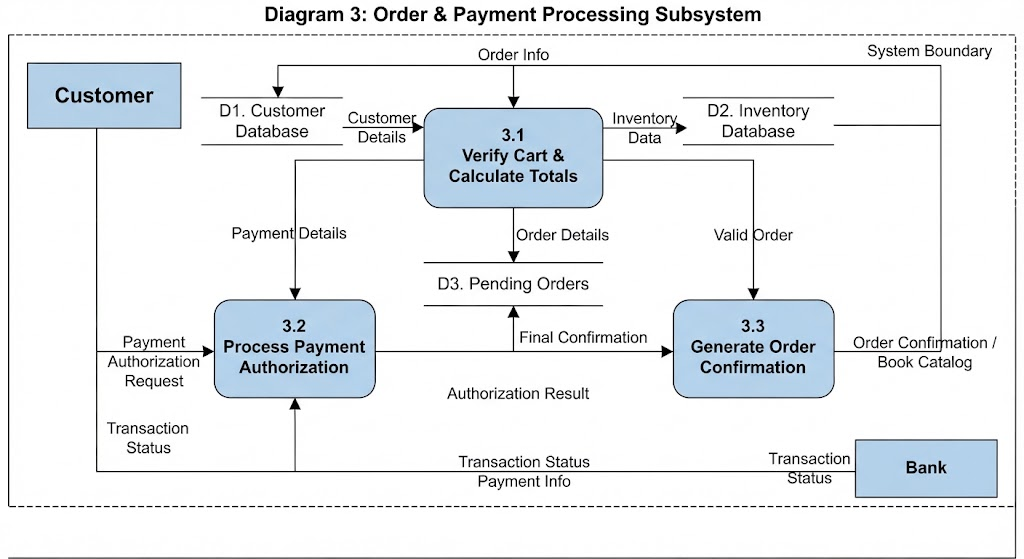
Diagram 3 illustrates the Order & Payment Processing Subsystem, showing the data flow between a Customer, Bank, and three internal processes: Verify Cart & Calculate Totals, Process Payment Authorization, and Generate Order Confirmation. The system interacts with Customer, Inventory, and Pending Orders databases, using Order Info, Payment Details, and Transaction Status as key data inputs and outputs.

Visualizing the Online Bookstore: A Level-0 DFD Guide

Visualizing the Online Bookstore: A Level-0 DFD Guide

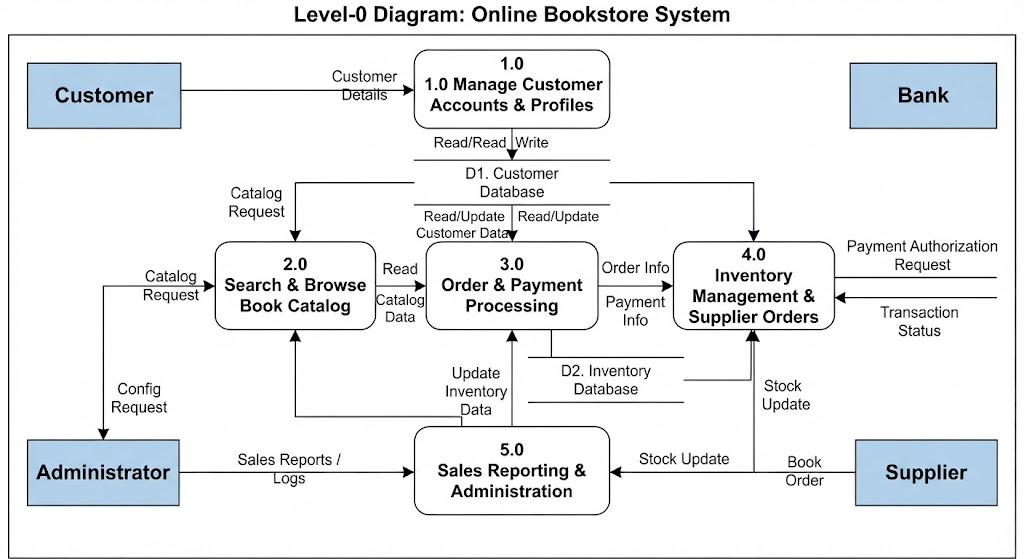
The Level-0 Data Flow Diagram for an Online Bookstore System illustrates the interactions between external entities—Customer, Administrator, Bank, and Supplier—and five core internal processes including managing customer accounts, browsing the book catalog, processing orders and payments, handling inventory and supplier orders, and generating sales reports. Data stores (Customer Database and Inventory Database) and labeled data flows show how information moves through the system to support its functions.

Decoding the Online Bookstore Context Diagram

Decoding the Online Bookstore Context Diagram

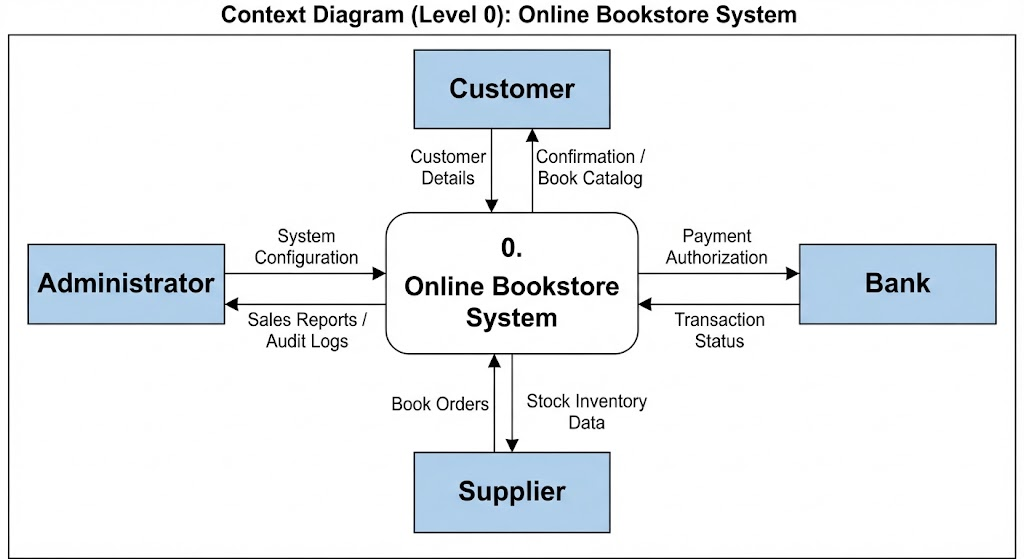
The diagram is a Level 0 context diagram of an Online Bookstore System, centered around the system itself and connected to four external entities: Customer, Administrator, Bank, and Supplier. Each entity interacts with the system through specific data flows such as book orders, payment authorization, system configuration, and stock inventory data.

Mastering Level 2 DFDs: The Borrow Processing Workflow

Mastering Level 2 DFDs: The Borrow Processing Workflow

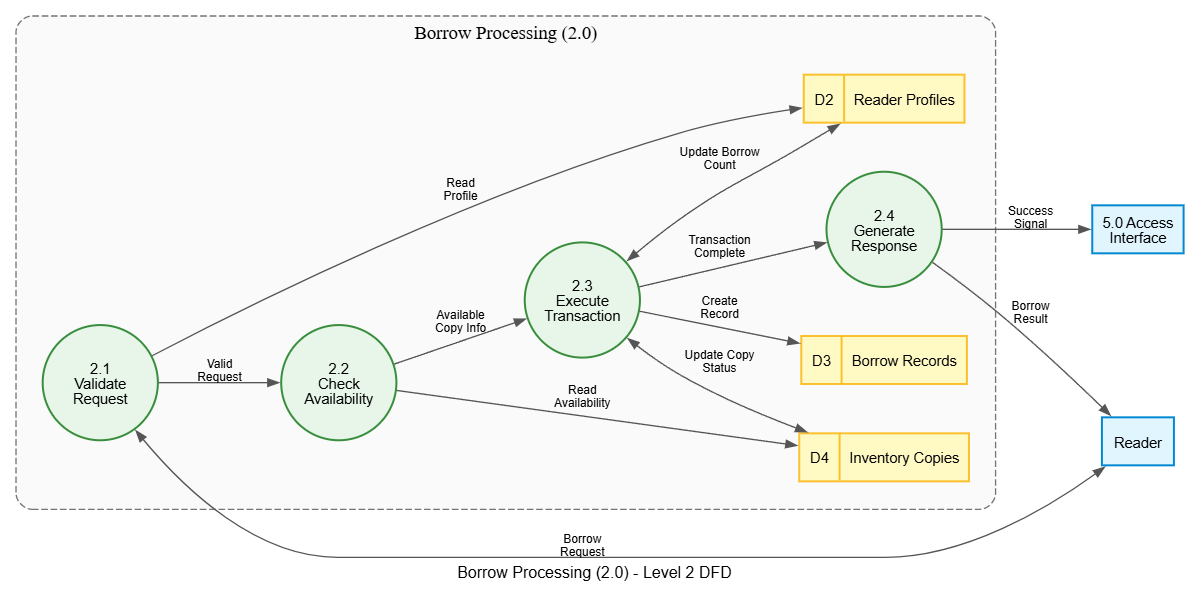
The Level 2 Data Flow Diagram titled “Borrow Processing (2.0)” illustrates the sequential workflow of four circular processes: Validate Request, Check Availability, Execute Transaction, and Generate Response. These processes interact with four rectangular data stores—Reader Profiles, Borrow Records, and Inventory Copies—while exchanging defined data flows such as “Valid Request,” “Available Copy Info,” and “Transaction Complete.” External entities including a Reader and the 5.0 Access Interface appear on the right, receiving outputs like “Borrow Result” and “Success Signal,” while a “Borrow Request” feeds back into the start of the process loop.

Mastering Level 1 DFDs: The Library Borrowing System

Mastering Level 1 DFDs: The Library Borrowing System

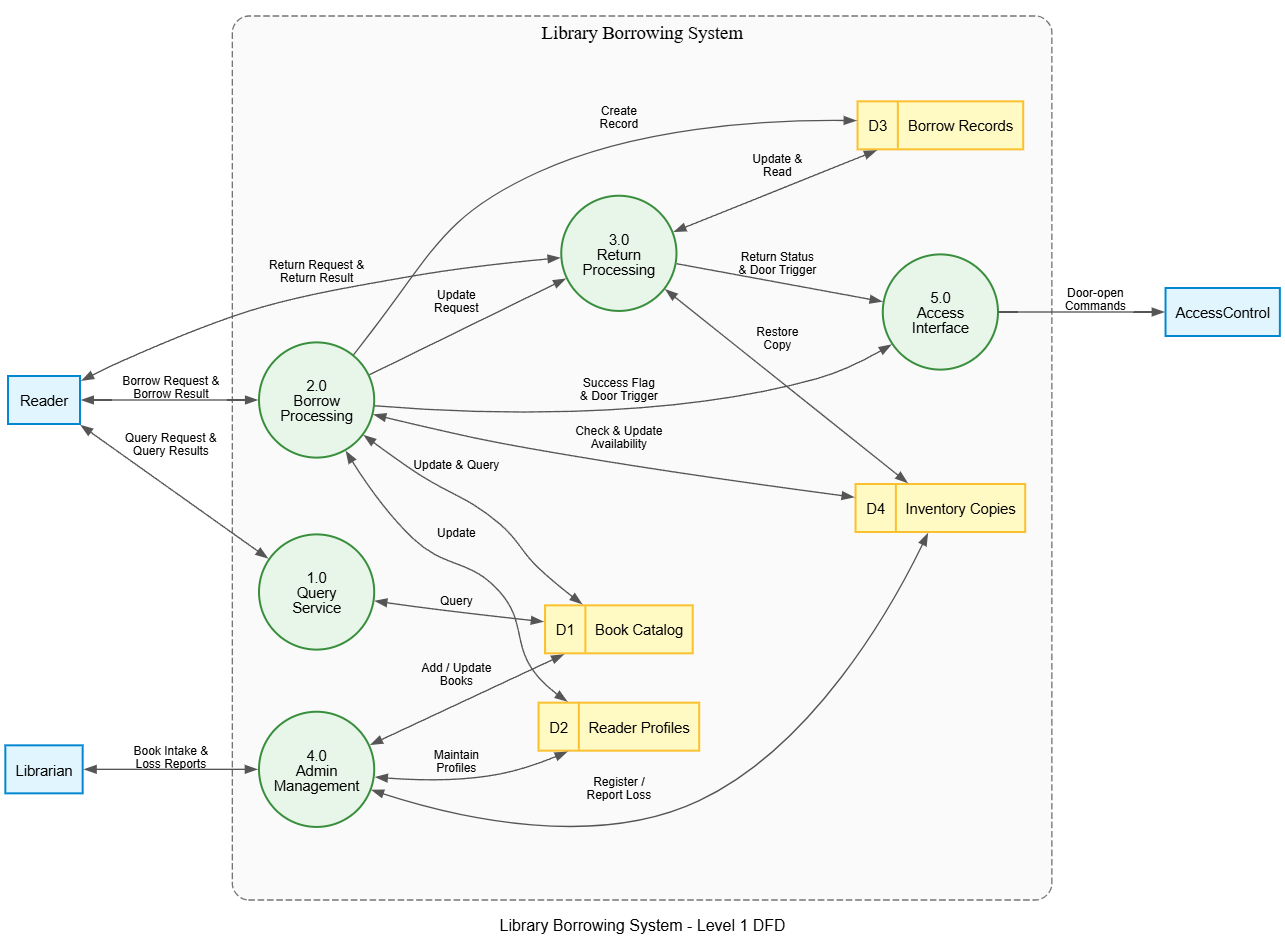
The Level 1 Data Flow Diagram for the Library Borrowing System maps interactions between Reader and Librarian entities, processes such as Borrow Processing and Return Processing, data stores including the Book Catalog, and the external Access Control system.

Mastering Context Diagrams with VPasCode

Mastering Context Diagrams with VPasCode

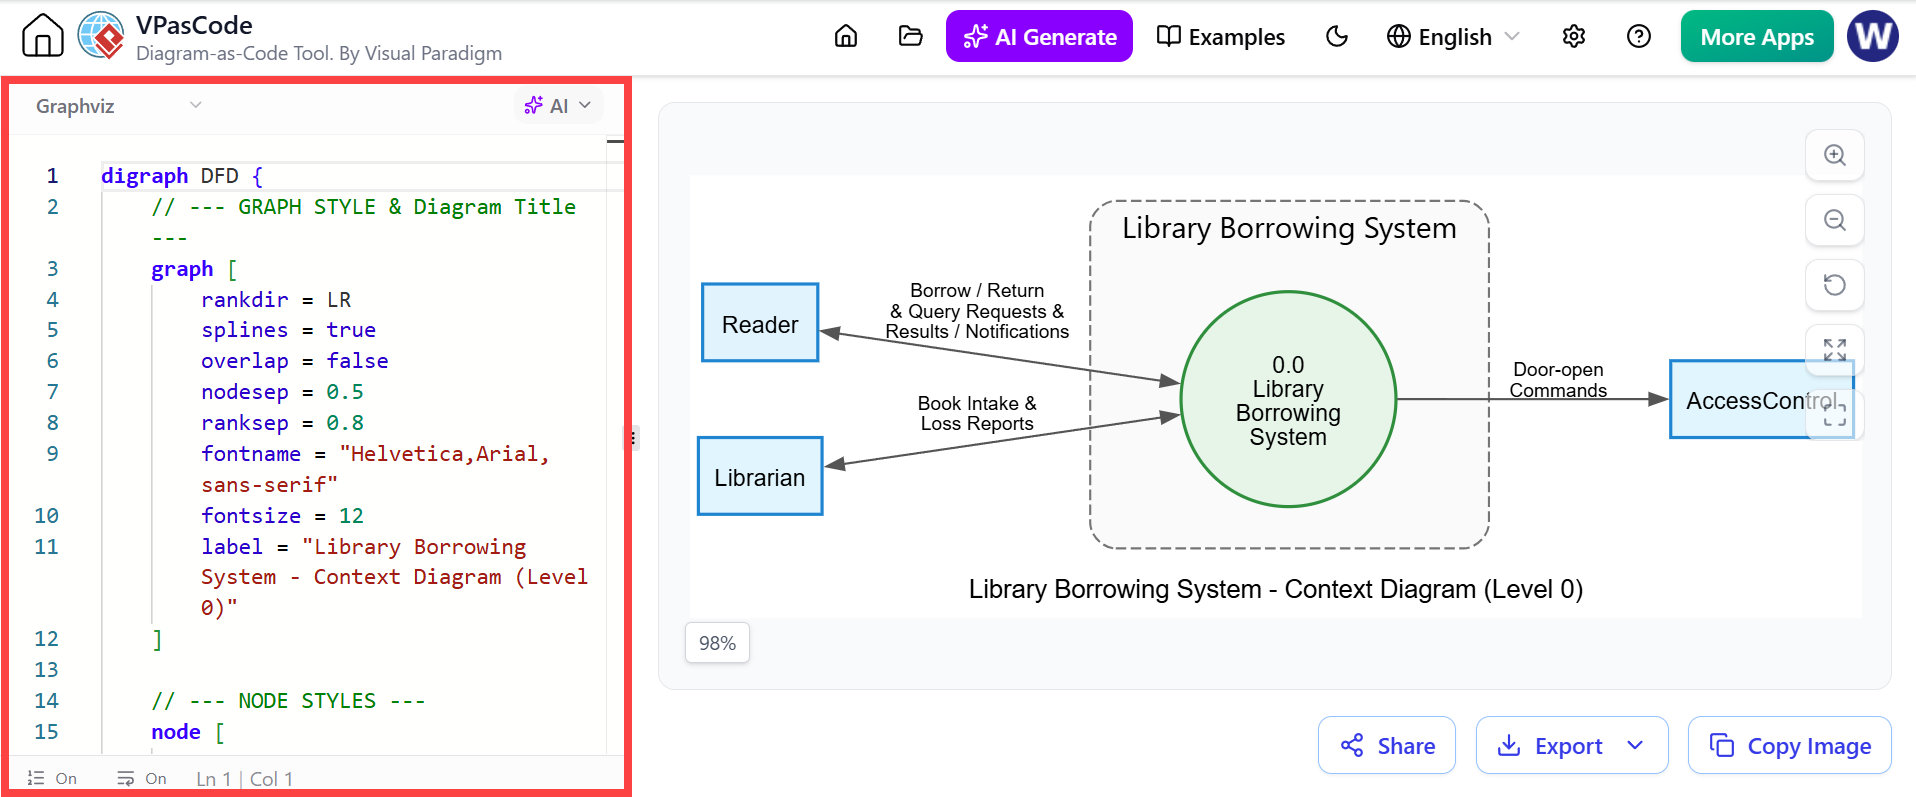
A Graphviz code snippet defines a Level 0 Data Flow Diagram (DFD) titled “Library Borrowing System – Context Diagram (Level 0)”. The generated visual diagram displays the central “0.0 Library Borrowing System” process interacting with external entities: “Reader”, “Librarian”, and “AccessControl”, showing the flow of data such as “Borrow / Return & Query Requests” and “Door-open Commands”.

Mastering DFDs: Exporting from Chatbot to VPasCode

Mastering DFDs: Exporting from Chatbot to VPasCode

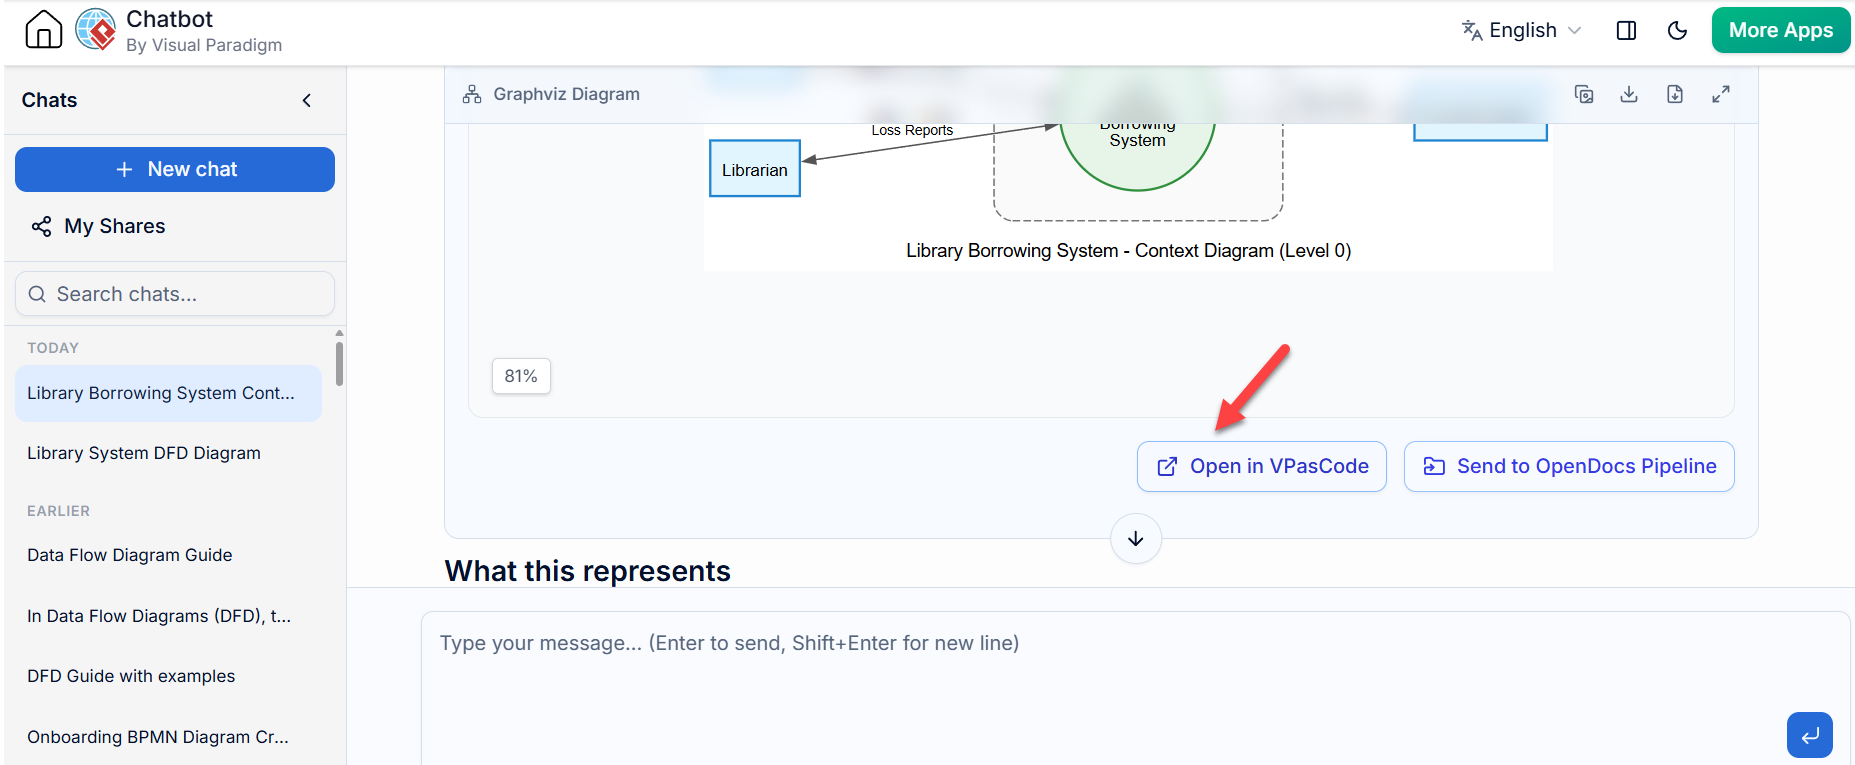
An interactive chatbot interface displays a Library Borrowing System context diagram labeled Level 0, with a red arrow pointing to an “Open in VPasCode” button below the graph. The surrounding UI shows sidebar navigation for chat history and recent topics on Data Flow Diagrams (DFD).

Mastering Hierarchical Data Flow Diagrams DFDS

Mastering Hierarchical Data Flow Diagrams DFDS

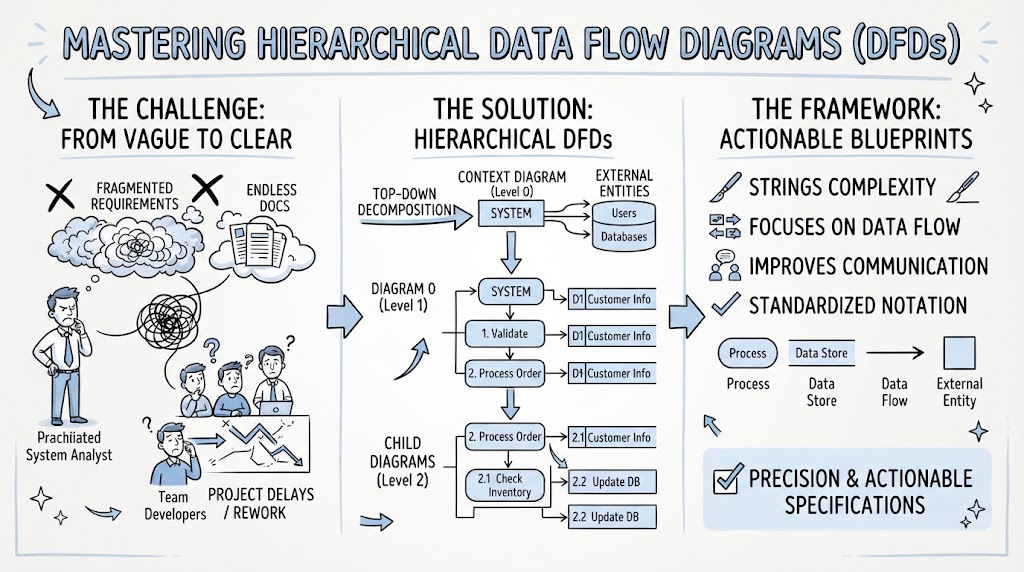
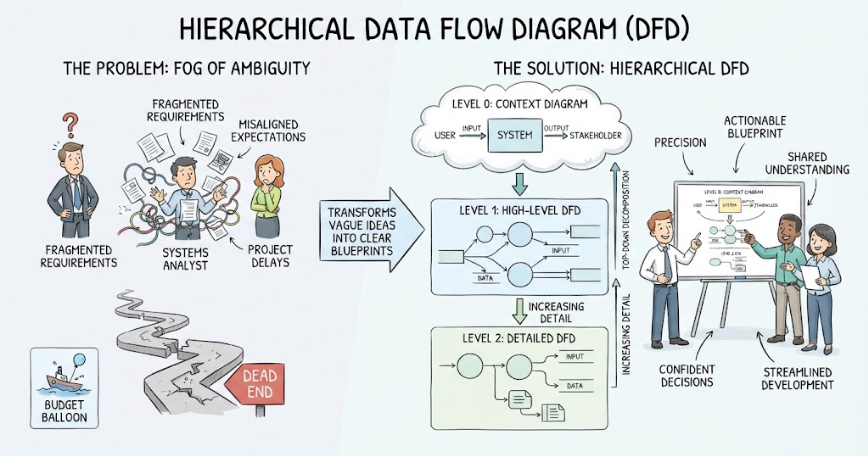
Hierarchical Data Flow Diagrams resolve project delays and vague requirements through top-down decomposition from a Level 0 context diagram to detailed Level 1 and Level 2 child diagrams using standardized notation for actionable specifications.

Mastering Modern Data Flow Diagrams with AI Assistance

Mastering Modern Data Flow Diagrams with AI Assistance

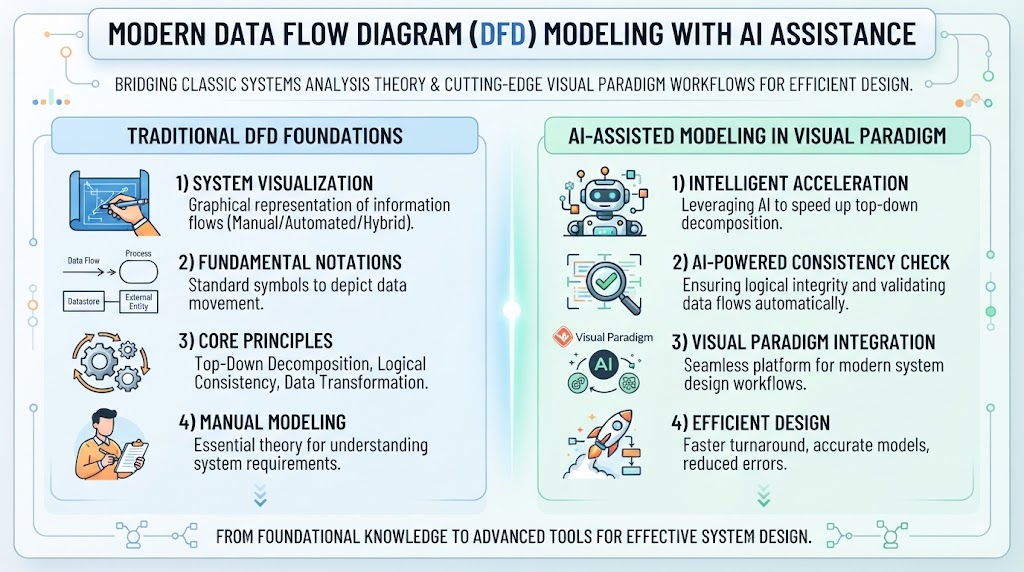
Infographic comparing traditional Data Flow Diagram (DFD) foundations with AI-assisted modeling in Visual Paradigm. Sections detail system visualization, fundamental notations, core principles, manual modeling, intelligent acceleration, AI-powered consistency checks, platform integration, and efficient design benefits.

Прокрутить вверх