


Understanding Data Flow Diagrams: A Video Rental Shop Example
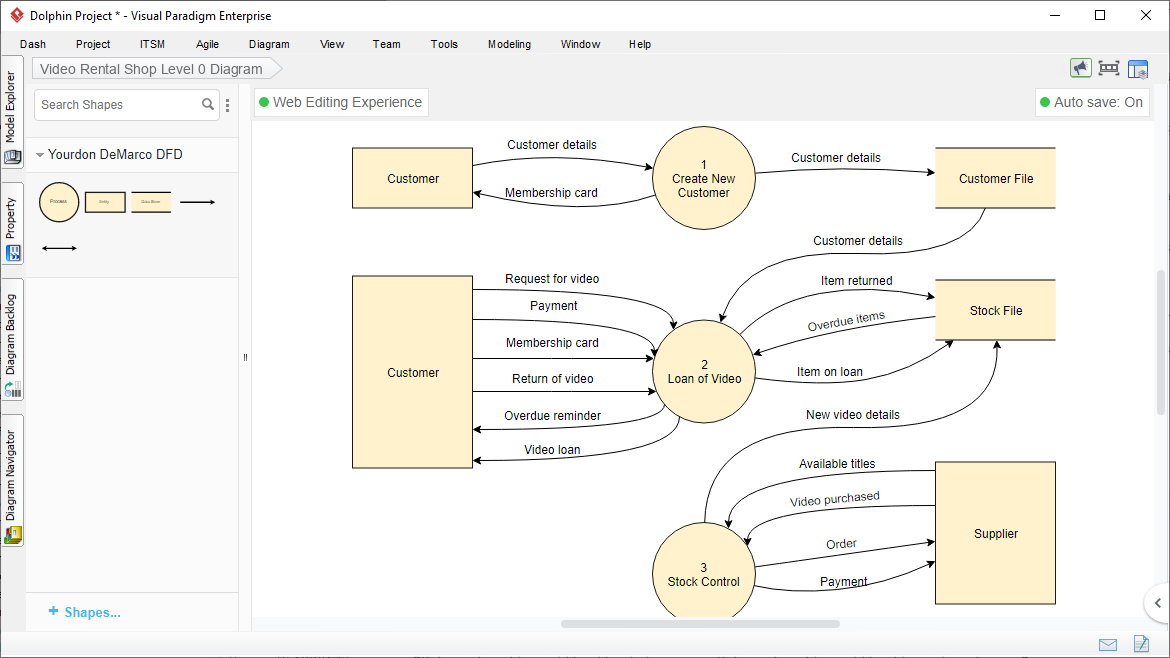
Welcome to this tutorial session. Today, we are going to deconstruct a classic example of systems analysis: a Data Flow Diagram (DFD) for a Video Rental Shop. By examining the screenshot provided, which is a Level 0 DFD created in Visual Paradigm Enterprise, we can learn how data moves through a system, where it is stored, and how it is transformed.
A DFD is a graphical representation that shows the flow of data through an information system. Unlike a flowchart, which focuses on control flow (logic), a DFD focuses on data flow. It helps us understand the “what” of the system rather than the “how.”
Key Components of the Diagram
Before we dive into the specific processes, let’s identify the four fundamental building blocks visible in this diagram:
- External Entities (The Rectangles on the edges): These represent sources or destinations of data that are outside the scope of the system. In our diagram, we see the Customer and the Supplier. They provide input or receive output but do not process the data themselves.
- Processes (The Circles): These represent actions that transform data. You will see three numbered circles: “1 Create New Customer,” “2 Loan of Video,” and “3 Stock Control.” These are the functional areas of our video rental system.
- Data Stores (The Open-ended Rectangles): These represent places where data is stored at rest. We have a Customer File and a Stock File. Think of these as databases or filing cabinets.
- Data Flows (The Arrows): These lines show the movement of data between entities, processes, and stores. The labels on the arrows (like “Customer details” or “Payment”) tell us exactly what information is being passed.
Walkthrough of the Processes
Let’s break down the system into its three main functional areas to see how data travels.
Process 1: Create New Customer
This is the onboarding phase. When a new person wants to rent videos, they interact with this process.
- The Customer sends Customer details to the process.
- The system validates this and saves the information into the Customer File (sending Customer details as the data flow).
- Finally, the system issues a physical token back to the customer, sending a Membership card back to the Customer entity.
Process 2: Loan of Video
This is the most complex part of the diagram, handling the daily rental operations. Notice how the Customer entity interacts with this process multiple times.
- Inputs from Customer: The customer initiates the process by sending a Request for video, Payment, and their Membership card. Interestingly, they can also send a Return of video to this same process, showing that one process handles both renting and returning.
- System Validation: Before processing the loan, the system checks the Customer File (indicated by the arrow coming from the file to the process) to ensure the membership card is valid.
- Outputs to Customer: Once the transaction is complete, the system sends the Video loan to the customer. If a video is late, the system generates an Overdue reminder.
- Updating Inventory: The process communicates with the Stock File to update the status of the videos. It sends data indicating an Item returned, an Item on loan, or flags Overdue items.
Process 3: Stock Control
This process manages the relationship with the suppliers who provide the videos. It ensures the shop has enough inventory.
- Interaction with Supplier: The Supplier sends Available titles and confirms when Video purchased has arrived. In response, the system sends an Order to the supplier and processes a Payment.
- Updating the Database: When new stock arrives or details change, this process sends New video details to the Stock File, ensuring the inventory database is accurate.
Conclusion
By analyzing this Level 0 DFD, we can see that the Video Rental Shop system is not just a single “black box.” It is a collection of interconnected processes. Data flows in from customers and suppliers, gets transformed (validated, recorded, calculated), and is stored in files for future retrieval. This visual model is crucial for developers and analysts because it clearly defines the boundaries of the system and the data required to make it function.