Welcome to Your Session on Business Process Modeling
Hello everyone, and welcome to our tutorial session. Today, we are diving into a crucial skill for any business analyst or process improvement specialist: BPMN, or Business Process Model and Notation. Think of BPMN as the universal language of business workflows. It provides a standardized graphical notation that serves as a vital bridge between Business Analysts and Technical Developers, ensuring everyone is on the same page when discussing complex operations.
The Foundational Elements: Key Shapes and Symbols
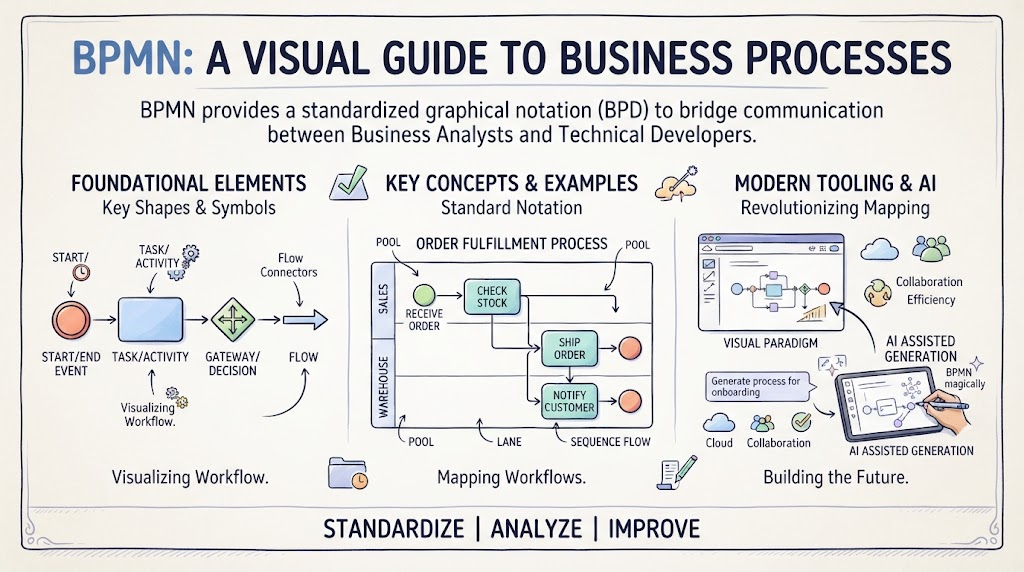
Before we can map out a complex enterprise system, we need to understand the alphabet of this visual language. The infographic outlines the foundational elements that make up a BPMN diagram. These are the building blocks you will use to visualize workflows.
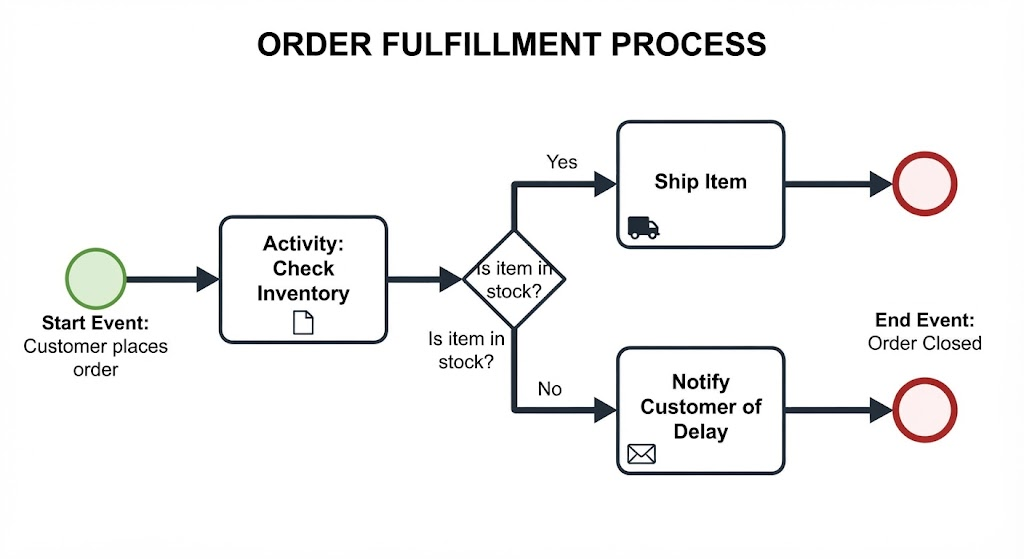
First, look at the Start/End Event. Represented by a simple orange circle, this marks the beginning or the conclusion of a process. It tells you where the story starts and where it finishes.
Next, we have the Task/Activity. This is usually depicted as a blue rounded rectangle. This symbol represents the actual work being done—any action that consumes time and resources. If a process involves doing something, it goes in a task box.
Then, we encounter the Gateway/Decision. Shown as a diamond shape, this is where the logic happens. It represents a branching point where the process can go in different directions based on a specific condition or decision. Finally, Flow Connectors (the arrows) guide the eye, showing the sequence of events and the direction of the workflow.
Key Concepts and Real-World Examples
Now that we know the shapes, let’s see how they fit together in a standard notation. The central example in our guide is the Order Fulfillment Process. This is a classic business scenario that illustrates how different departments interact.
In BPMN, we use a concept called a Pool. You can think of a pool as the container for the entire process. In our example, the pool represents the entire organization handling the order. Inside the pool, we have Lanes. Lanes are used to categorize activities by specific roles or departments. Here, we see a “Sales” lane and a “Warehouse” lane.
Let’s trace the flow. The process starts in the Sales lane with a “Receive Order” task. Once the order is received, it moves to the Warehouse lane. Here, a decision is made: “Check Stock.” If stock is available, the process flows to “Ship Order” and then “Notify Customer.” This visual mapping allows us to see exactly how a request moves from sales to logistics without getting lost in text-heavy documentation.
Modern Tooling and the Rise of AI
The field of process modeling is evolving rapidly. We are no longer limited to drawing boxes on a whiteboard. Modern tooling and AI are revolutionizing how we map these processes.
Tools like Visual Paradigm allow for seamless Collaboration and Efficiency. Instead of working in silos, teams can work on the same diagram simultaneously. But the most exciting development is AI-Assisted Generation. Imagine being able to type a prompt like “Generate process for onboarding” and having the AI magically create the BPMN diagram for you. This technology helps organizations move faster, moving from manual mapping to building the future of automated process management.
The Ultimate Goal: Standardize, Analyze, Improve
Why do we go through all this effort? Why learn the shapes and use advanced AI tools? The answer lies in the three pillars at the bottom of our guide: Standardize, Analyze, and Improve.
By using a standard notation like BPMN, we eliminate ambiguity. By analyzing these visual maps, we can spot bottlenecks—like a warehouse that is always backed up. And finally, by improving these processes, we make our businesses more efficient and responsive. Whether you are mapping a simple task or a complex global supply chain, BPMN is your roadmap to success.