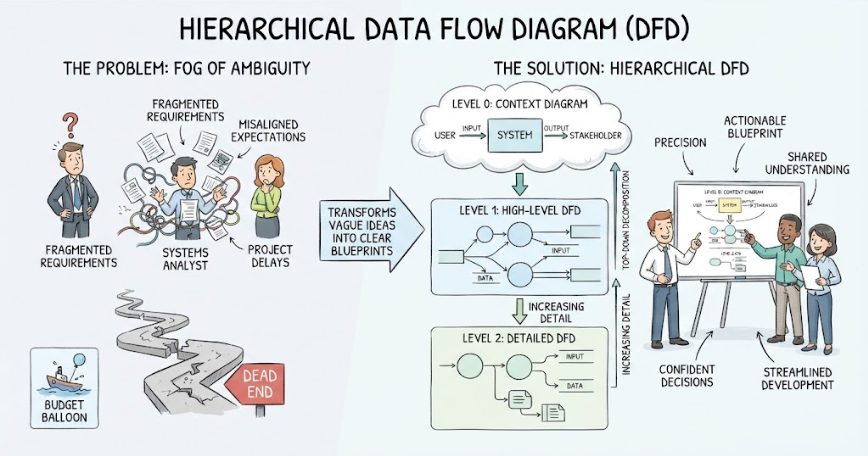
Navigating the Fog of Ambiguity in System Design
Imagine you are stepping into the role of a systems analyst. You are handed a project, but the requirements are scattered, the expectations are misaligned, and the path forward feels like a winding, treacherous road leading directly to a “dead end.” This scenario is all too common in software development and systems engineering. We call this the “fog of ambiguity.” It manifests as fragmented requirements, budget balloons that go out of control, and project delays that frustrate everyone involved.
The systems analyst in this scenario is often overwhelmed by documents and tangled wires, unable to see the forest for the trees. However, there is a proven solution to cut through this confusion: the Hierarchical Data Flow Diagram, or H-DFD. This powerful tool transforms vague ideas into clear blueprints, guiding your project from a chaotic mess to a streamlined success.
The Solution: A Hierarchical Approach
Instead of trying to understand the entire system at once, which leads to confusion, the hierarchical DFD approach breaks the problem down into manageable layers. Think of it as zooming in on a map. You start with the big picture and gradually zoom in until you see every street and building. This process is known as “top-down decomposition,” ensuring that increasing detail is added at every stage without losing the overall context.
Level 0: The Context Diagram
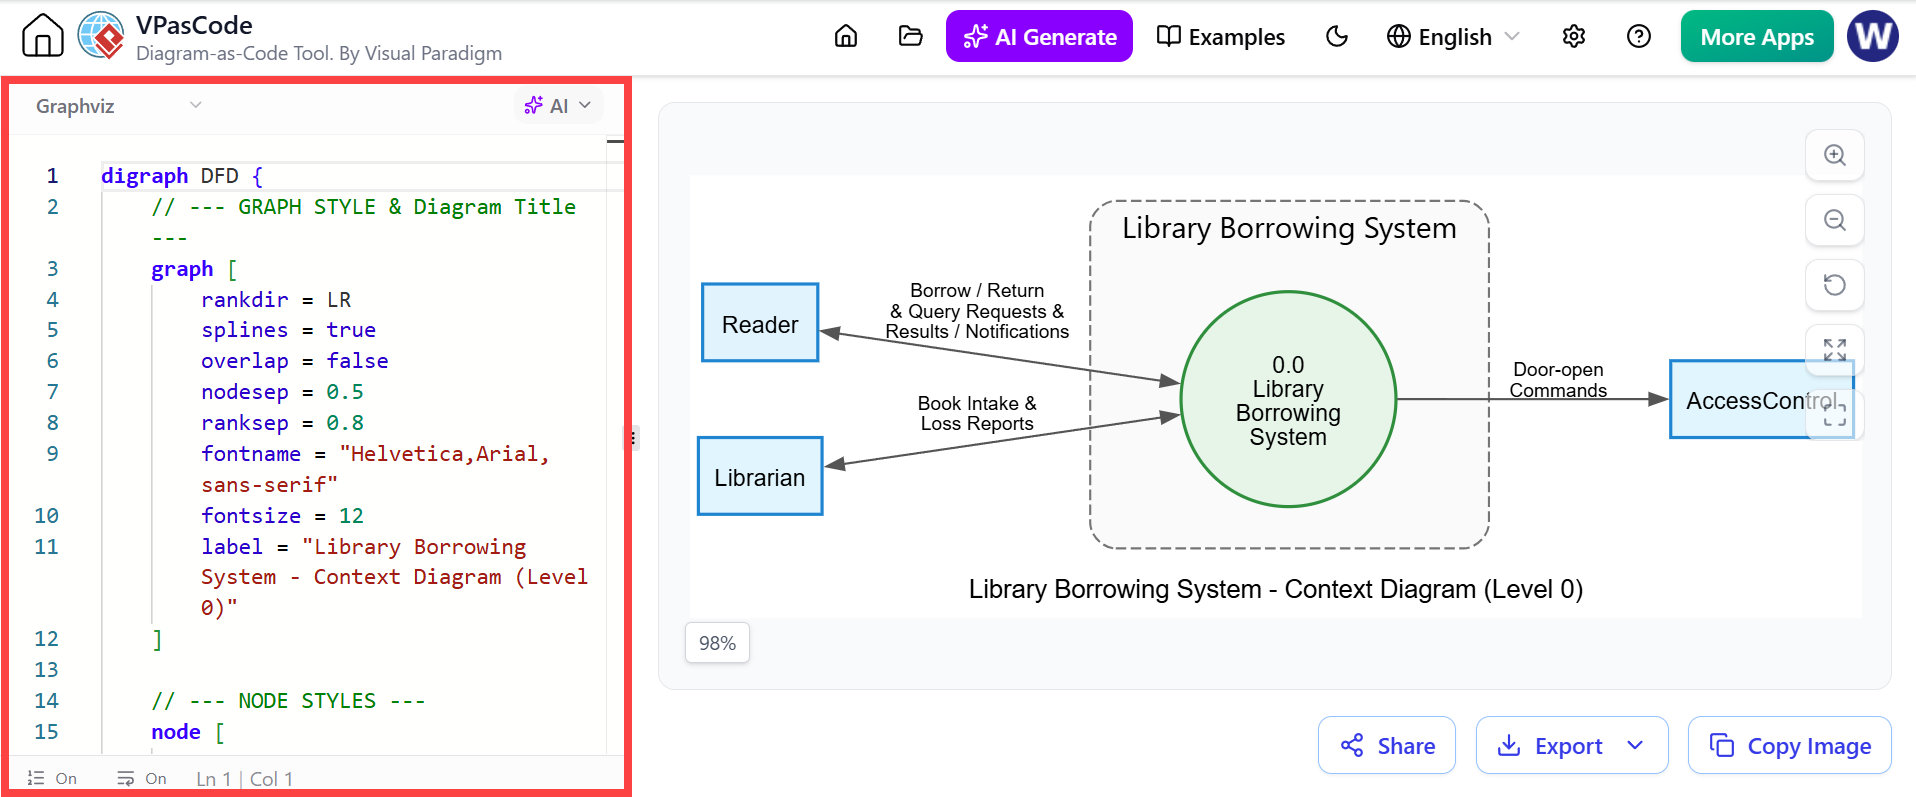
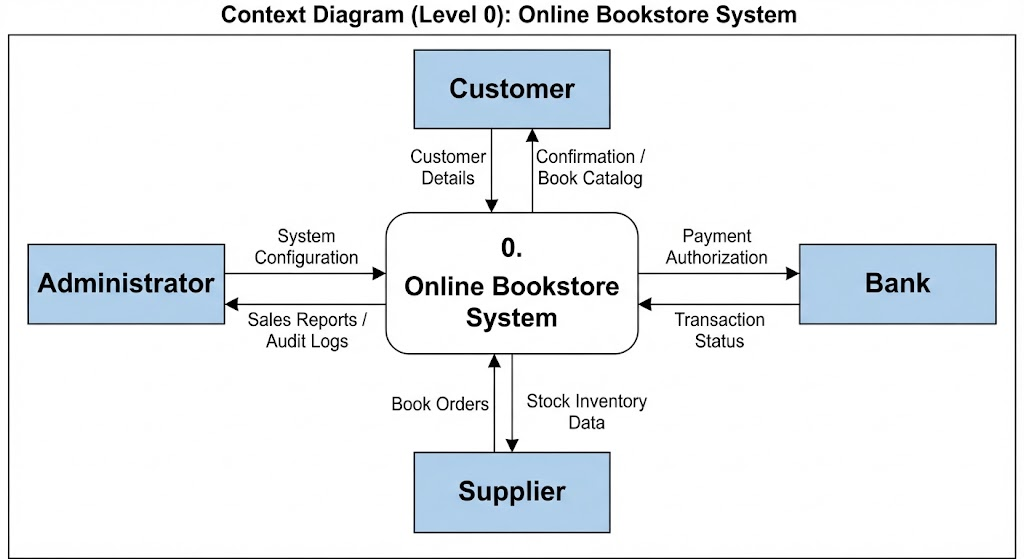
Our journey begins at Level 0, known as the Context Diagram. This is the bird’s-eye view of your system. In this high-level view, the entire system is represented as a single process box. The diagram clearly identifies the external entities interacting with the system—typically the User and the Stakeholder.
The flow is simple but critical: Input flows from the User into the System, and Output flows from the System to the Stakeholder. This level answers the fundamental question: “What is the system, and who does it serve?” It sets the boundaries and ensures everyone agrees on the scope before getting bogged down in details.
Level 1: The High-Level DFD
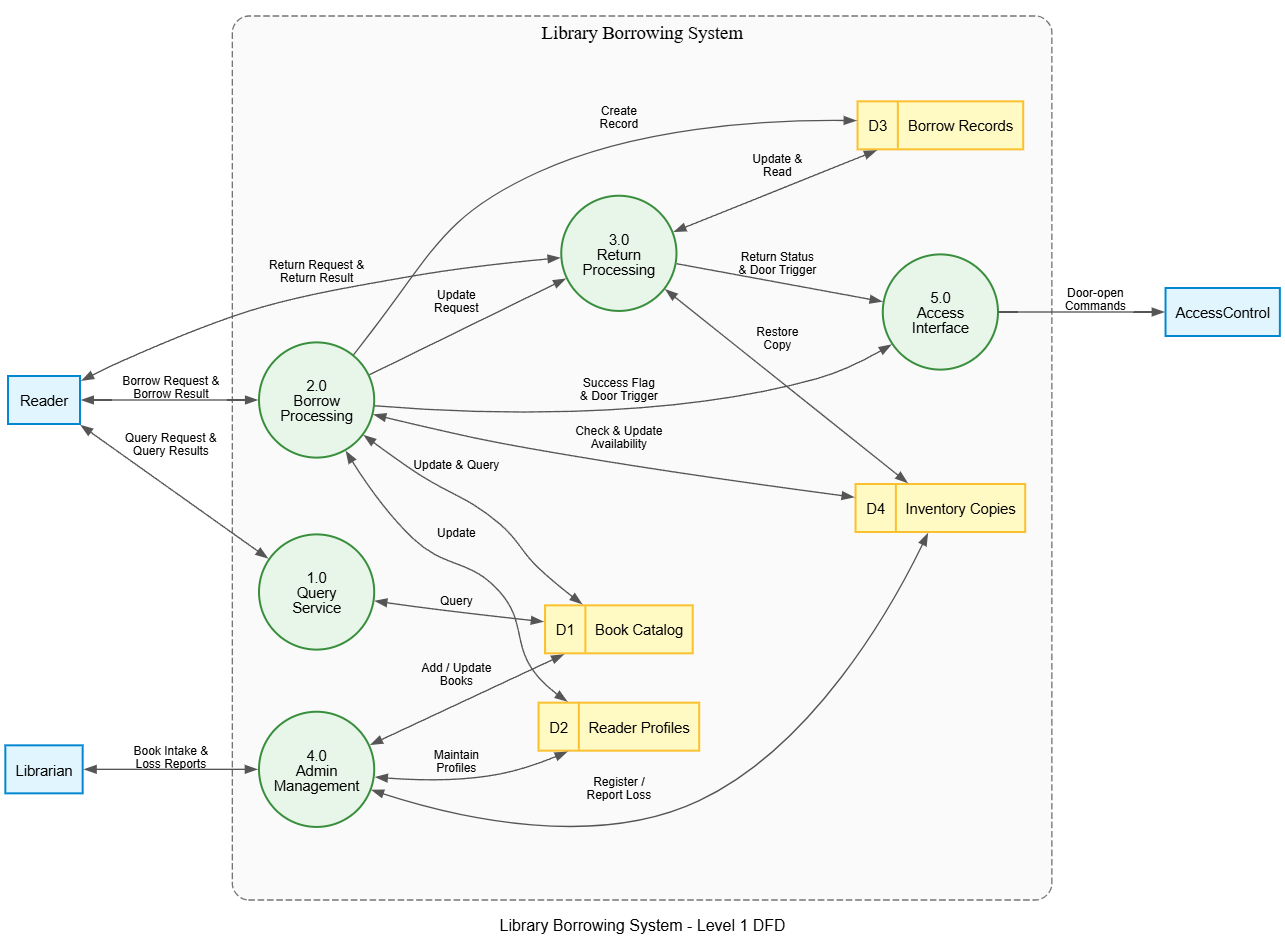
Once the context is established, we move to Level 1. This is where the magic of decomposition happens. We take that single system box from Level 0 and break it down into its major processes or sub-systems. You will see circles representing these processes connected by data flows.
At this stage, you are mapping out the major functions of the system. For example, if the system is an online store, Level 1 might show processes like “Process Order,” “Manage Inventory,” and “Handle Payments.” This level provides the skeleton of the application, showing how data moves between the major components.
Level 2: The Detailed DFD
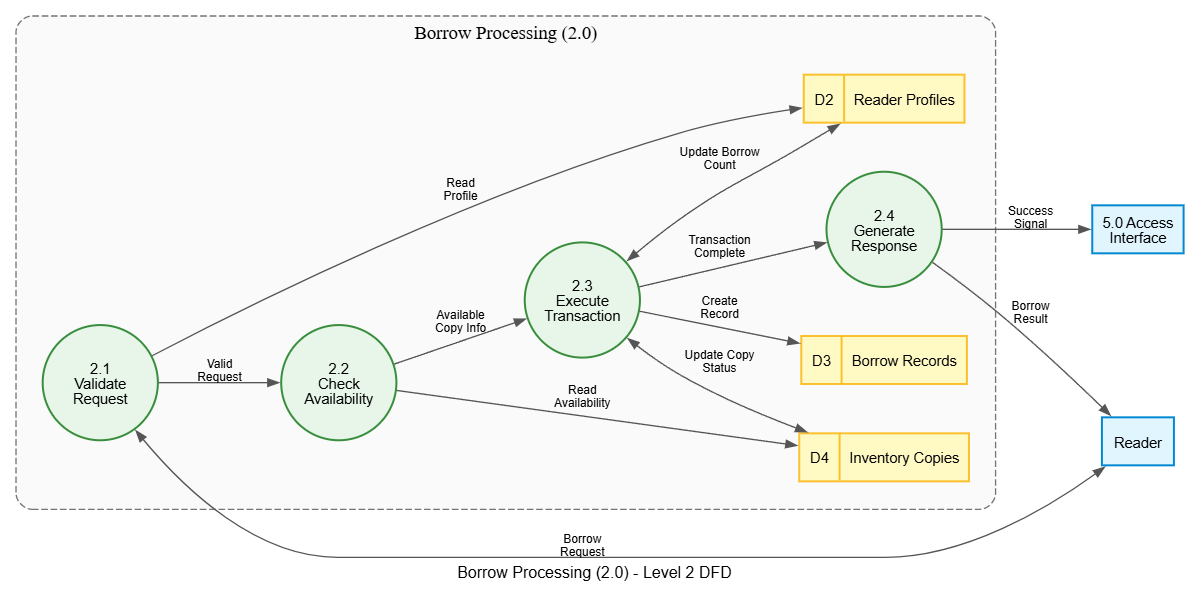
For even greater precision, we dive into Level 2. This is the granular view where we expand specific processes from Level 1 into even more detailed steps. Here, you define exactly how data is transformed. You will see specific inputs, outputs, and data stores (represented by open-ended rectangles) that hold information.
This level is essential for developers. It acts as a precise instruction manual, ensuring that the logic behind every calculation and data transfer is documented and understood. It turns the high-level concept into an actionable blueprint.
Achieving Shared Understanding and Streamlined Development
Why go through the effort of creating these diagrams? The visual shift from the left side of the problem to the right side of the solution is profound. When you present a hierarchical DFD to your team, you achieve several critical goals:
- Shared Understanding: The diagram acts as a common language. Developers, stakeholders, and analysts can all look at the same visual and understand the system’s logic without ambiguity.
- Actionable Blueprint: The diagrams are not just drawings; they are technical specifications that guide the actual coding and construction of the system.
- Confident Decisions: With a clear map of data flows, stakeholders can make decisions based on facts and logic rather than guesses.
- Streamlined Development: By identifying data flows and processes early, you avoid costly rework later. The project moves forward with confidence, avoiding the “dead end” of project failure.
By mastering the Hierarchical Data Flow Diagram, you transform the fog of ambiguity into a clear path forward. You move from fragmented chaos to a structured, precise, and successful system design.