Welcome to this tutorial session on Business Process Management (BPM). In any initiative to improve organizational efficiency, the golden rule is to understand the current reality before attempting to design a future state. We call this the “As-Is” process. Today, we will analyze a case study from Apex Manufacturing to understand how to visualize, document, and identify gaps in a complex fulfillment workflow.
Visualizing the Current Reality
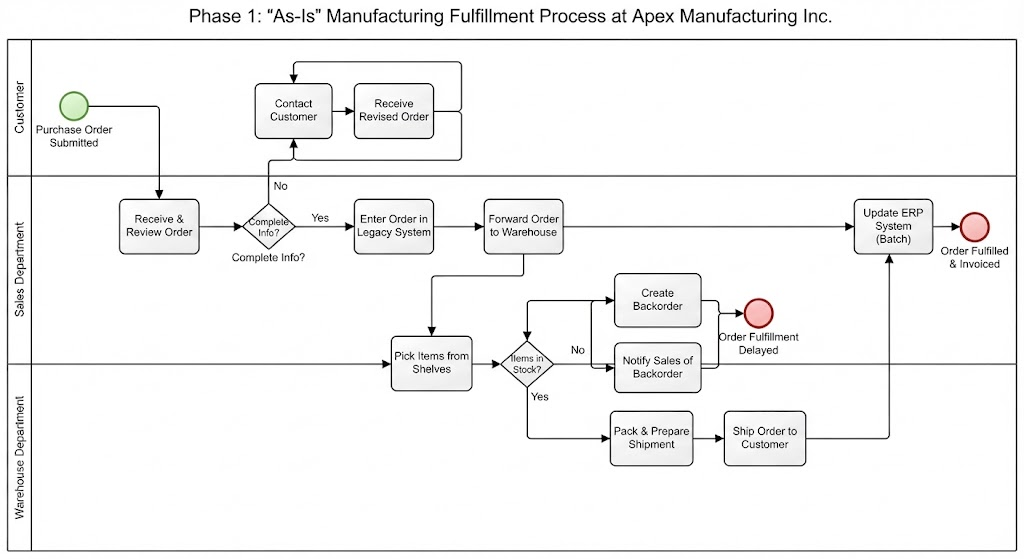
Let us begin by examining the process flow. The diagram provided illustrates the manufacturing fulfillment process at Apex Manufacturing. This is a classic swimlane diagram, a standard notation often used in tools like Visual Paradigm to clarify responsibilities across different departments. We can clearly see three distinct lanes: the Customer, the Sales Department, and the Warehouse Department.
When we trace the flow from the green start event (“Purchase Order Submitted”), several critical characteristics of the As-Is state emerge:
- Heavy Reliance on Manual Tasks: Notice that almost every step is a rectangle, representing a manual activity. From the customer submitting the order to the sales representative reviewing it, human intervention is the primary driver of the process.
- Reactive Error Handling: Look closely at the Sales Department lane. There is a decision diamond labeled “Complete Info?”. If the answer is “No,” the process loops back to the customer via a “Contact Customer” task. This creates a significant delay loop where the entire process halts until the customer responds.
- Siloed Warehouse Operations: The Warehouse Department performs a manual check (“Pick Items from Shelves”). If items are missing (“No” on the “Items in Stock?” decision), the process splits into creating a backorder and notifying Sales. This notification likely happens via a separate, non-integrated channel, creating a silo.
- Delayed Data Synchronization: Perhaps the most critical observation is the “Update ERP System” task. This occurs late in the cycle, after the order has been shipped. This batch update means that financial and inventory data are likely out of sync during the crucial picking and packing phases.
The Role of Visual Modeling Tools
How do we effectively capture these complexities? This is where professional modeling software like Visual Paradigm becomes indispensable. In a manual or spreadsheet-based environment, tracking the “No” paths and loops described above is nearly impossible. Visual Paradigm allows analysts to:
- Standardize Notation: It enforces BPMN (Business Process Model and Notation) standards, ensuring that diamonds represent decisions and rounded rectangles represent tasks, making the diagram readable by stakeholders regardless of their technical background.
- Visualize Dependencies: The tool automatically draws the sequence flows, making the “Contact Customer” loop immediately obvious to the viewer, highlighting exactly where the process bottlenecks.
- Facilitate Collaboration: By creating a clear visual map, Visual Paradigm bridges the gap between the Sales team, the Warehouse team, and IT, ensuring everyone agrees on what the current “As-Is” reality looks like before proposing changes.
Identifying the Gaps: A Detailed Analysis
Once the As-Is state is modeled, we can perform a gap analysis to identify where the process fails to meet business goals. Based on the Apex Manufacturing example, we can identify four critical areas for improvement.
1. Order Submission and Data Validation
Currently, Sales relies on manual review to catch missing information. This is a classic inefficiency where skilled labor is wasted on administrative checks. A gap exists because there is no automated validation at the point of entry. This leads to increased cycle times and a high risk of human error slipping through the cracks.
2. Customer Exception Handling
The follow-up on incomplete orders is currently manual and slow. The “Contact Customer” task creates a waiting period. The gap here is a lack of automated communication triggers. The impact is twofold: it causes customer frustration due to delays and delays revenue recognition for the company.
3. Inventory and Backorder Management
Inventory checks are currently discrete events—happening only when an order is picked—rather than continuous monitoring. Furthermore, backorder notifications are not instantaneous. The gap is the lack of real-time inventory visibility. This means Sales teams might sell stock that isn’t actually available, leading to promises that cannot be kept.
4. Warehouse Fulfillment and ERP Synchronization
Finally, we look at the disconnect between physical fulfillment and digital records. Picking, packing, and shipping are manual touches disconnected from the central ERP until the very end of the process. This gap results in a lack of real-time visibility into order status and increases the potential for shipping errors due to outdated data.
Conclusion
By visualizing the As-Is state using tools like Visual Paradigm, we transform a confusing set of manual tasks into a clear map of inefficiencies. The next step for Apex Manufacturing would be to design an “To-Be” process that automates the validation, integrates the ERP updates in real-time, and streamlines the exception handling loops. But as we have seen today, you cannot improve what you cannot see.