Before diving into the specifics of process modeling, it is crucial to understand the tool selection. Why choose Visual Paradigm over generic diagramming tools or standard Business Process Management (BPM) suites? The answer lies in the depth of analysis required for true gap identification. Visual Paradigm was selected specifically because it offers True BPMN 2.0 Compliance. This ensures that the models created are not merely illustrative drawings but are analyzable data structures that can be rigorously tested.
Furthermore, the platform provides Integrated Gap Analysis Features, allowing teams to overlay “As-Is” and “To-Be” models with specific annotation layers to highlight discrepancies. It also supports Process Simulation, enabling us to test “To-Be” models against historical “As-Is” data before any implementation occurs. Finally, its Requirements Traceability links process gaps directly to business requirements, while the Collaborative Workspace enables real-time stakeholder validation.
Phase 1: Modeling the As-Is Reality
The first step in any credible gap analysis is establishing an uncontested baseline. Using Visual Paradigm, the team conducted three facilitated modeling sessions with frontline staff. The goal was to map the process exactly as it happens, not as management thinks it happens.
Key Tooling Application: Swimlane Discovery
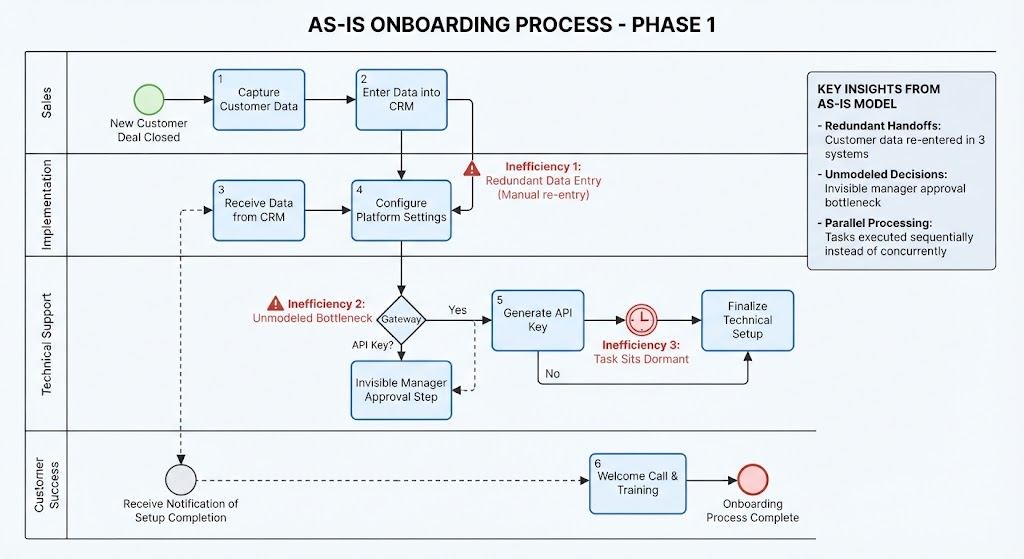
A critical feature utilized during this phase was Visual Paradigm’s swimlane auto-layout. The team mapped the onboarding process across four distinct departments: Sales, Implementation, Technical Support, and Customer Success. The tool’s ability to quickly reorganize lanes as understanding evolved was critical. For instance, early models placed “API Key Generation” in the Implementation lane, but discovery revealed it actually sat dormant in Technical Support for an average of 6 days. This dynamic reorganization capability ensured the model remained accurate as the team’s understanding deepened.
The As-Is Model Revealed Hidden Gaps
Once the process was modeled, Visual Paradigm’s path analysis highlighted several immediate issues that interviews alone had missed. The visual nature of the diagram exposed structural inefficiencies that stakeholders had normalized through familiarity.
Identifying the Inefficiencies
As we examine the “As-Is Onboarding Process,” the model reveals three distinct areas of friction:
- Redundant Handoffs: The model clearly shows that Customer Data is manually re-entered in three separate systems. This is flagged as Inefficiency 1 in the process flow, indicating a significant waste of time and a high risk of data entry error.
- Unmodeled Decision Points: A “manager approval” step existed in practice but had never been documented. This created an invisible bottleneck, labeled as Inefficiency 2. The diagram highlights this with a specific gateway decision point (“API Key?”) where a manual approval loop was hiding.
- Parallel Processing Failures: The diagram shows tasks that could theoretically run concurrently being executed sequentially due to legacy policy. Specifically, the task of generating an API key sits dormant (labeled Inefficiency 3) while waiting for manual inputs, breaking the flow of the process.
The Key Insight
The most profound takeaway from this phase is that the As-Is model itself became the first gap identification tool. By rendering the process visually within Visual Paradigm, the team moved beyond abstract descriptions to concrete visual evidence. The swimlanes made it impossible to ignore where the handoffs were failing, and the path analysis made the delays in the Technical Support lane undeniable. This visual clarity is the foundation upon which the “To-Be” model will be built.