Business Process Model and Notation (BPMN) is a powerful language for designing business processes. While many learners focus heavily on the sequence of events—the order in which tasks occur—equally critical is understanding what information is moving through those tasks. This is where the concept of Data Association becomes essential.
In this tutorial, we will deconstruct the concept of Data Association using a real-world example from a Nobel Committee nomination process. By the end, you will understand how to model the flow of documents and database objects distinct from the flow of time.
What is Data Association?
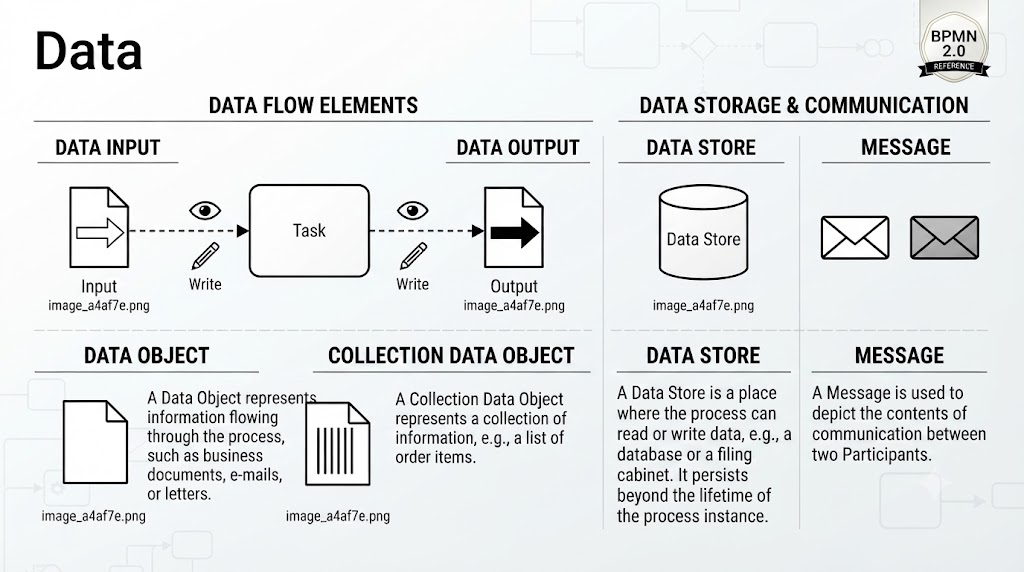
Data Association is a specific modeling element that defines the relationship between a Data Object (like a document, database record, or physical file) and an Activity (a task or process step). It answers the fundamental question: What data is required to perform this task, and what data does this task produce?
Unlike a Sequence Flow, which uses arrows to dictate the chronological order of events, a Data Association uses a dashed line to map the lifecycle of information. This separation is crucial for maintaining clean, readable diagrams where the logic of the process does not get cluttered by the flow of paperwork.
The Two Types of Data Association
In BPMN, there are two distinct directions for a Data Association, and understanding the difference is key to accurate modeling:
- Input Data Association: This points from a Data Object to an Activity. It signifies that the data is a prerequisite or input required to perform the task. Without this data, the task cannot begin.
- Output Data Association: This points from an Activity to a Data Object. It signifies that the task produces, updates, or creates this specific piece of data.
Case Study: The Nobel Committee Nomination Process
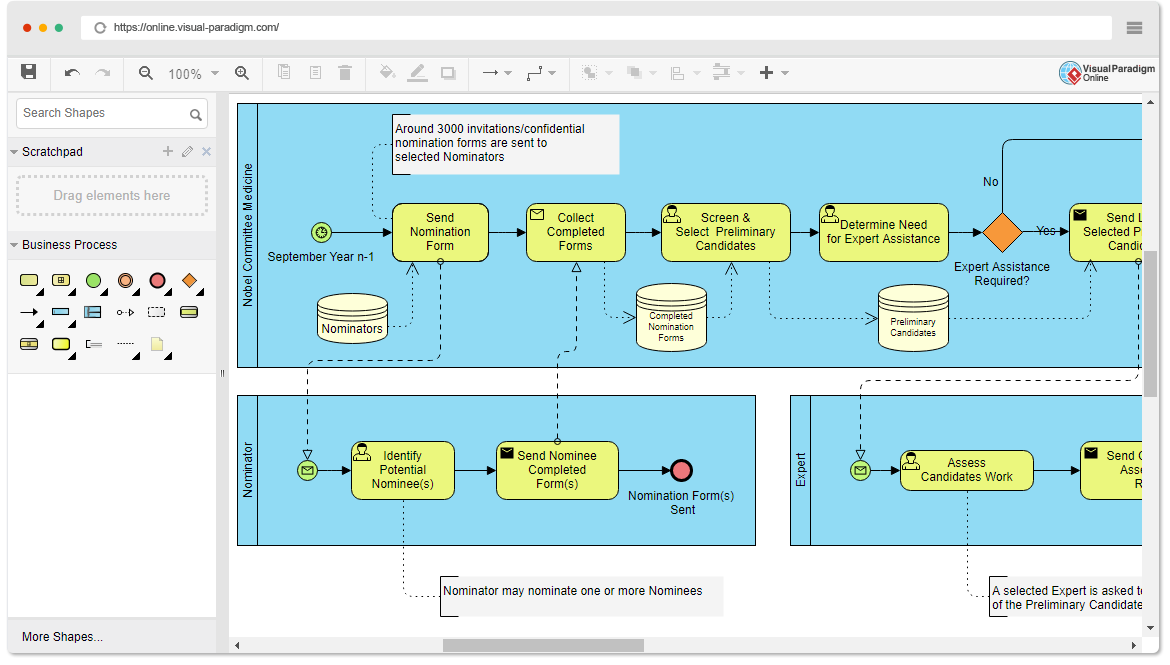
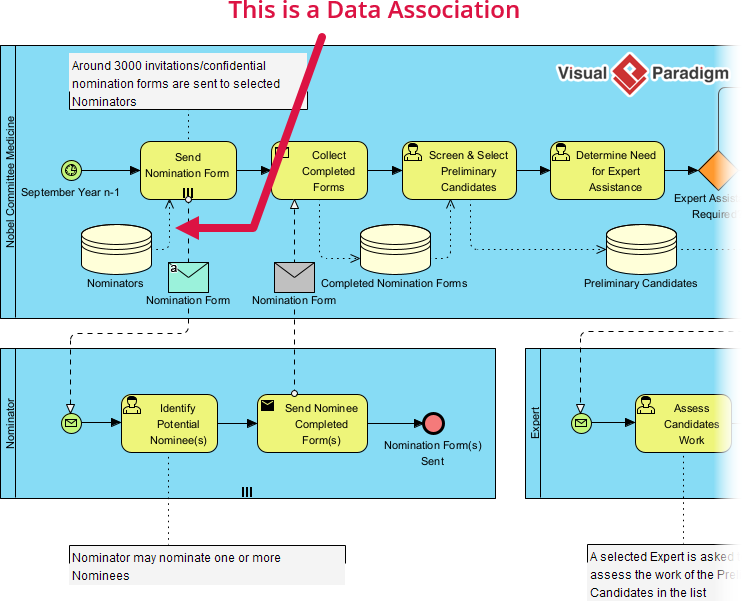
Let’s analyze the provided diagram, which illustrates a complex workflow managed by the Nobel Committee. Specifically, we will look at the “Nobel Committee Medicine” lane to see how Data Associations are applied.
1. The Activity: “Send Nomination Form”
Consider the yellow activity box labeled “Send Nomination Form”. This is a task that requires specific data to execute. The process dictates that invitations and forms must be sent to selected Nominators.
2. The Data Object: “Nomination Form”
Below the activity, you will see a document icon labeled “Nomination Form”. This is a Data Object. It represents the actual physical or digital document that needs to be transmitted.
3. The Visual Connection
The diagram highlights a specific Data Association with a red arrow. This dashed line connects the “Send Nomination Form” activity to the “Nomination Form” data object. Because the arrow points from the Activity to the Data Object (or interacts with it), it indicates that the form is being utilized or generated by this step.
The annotation box above further clarifies the volume and nature of this data association:
“Around 3000 invitations/confidential nomination forms are sent to selected Nominators”
Input vs. Output in Action
Looking closely at the diagram, you can see multiple data associations in play:
- Input Scenario: The “Collect Completed Forms” activity has a dashed line coming from the “Completed Nomination Forms” data store. This is an Input Data Association. The committee cannot screen candidates until they have collected the completed forms.
- Output Scenario: The “Screen & Select Preliminary Candidates” activity points to a data store labeled “Preliminary Candidates.” This suggests that the act of screening creates or updates a list of candidates. This is an Output Data Association.
Why Separation Matters: Sequence Flow vs. Data Association
A common mistake in process modeling is trying to show data movement using standard sequence flow arrows. However, the provided text emphasizes a vital rule:
Behavior: While Sequence Flow dictates what happens next, Data Associations dictate what data is needed or created.
If you mix these two, your diagram becomes a confusing tangle of lines. By using a dashed line for Data Association, you clearly signal to the reader: “This line is about information, not time.”
Summary
By mastering Data Associations, you create diagrams that are not just flowcharts, but comprehensive system architectures. You clearly define:
- Which tasks require specific inputs.
- Which tasks generate critical outputs.
- How data flows independently of the process timeline.
Whether you are using tools like Visual Paradigm or drawing by hand, always ensure your data associations are distinct from your sequence flows to maintain professional, clean, and understandable documentation.