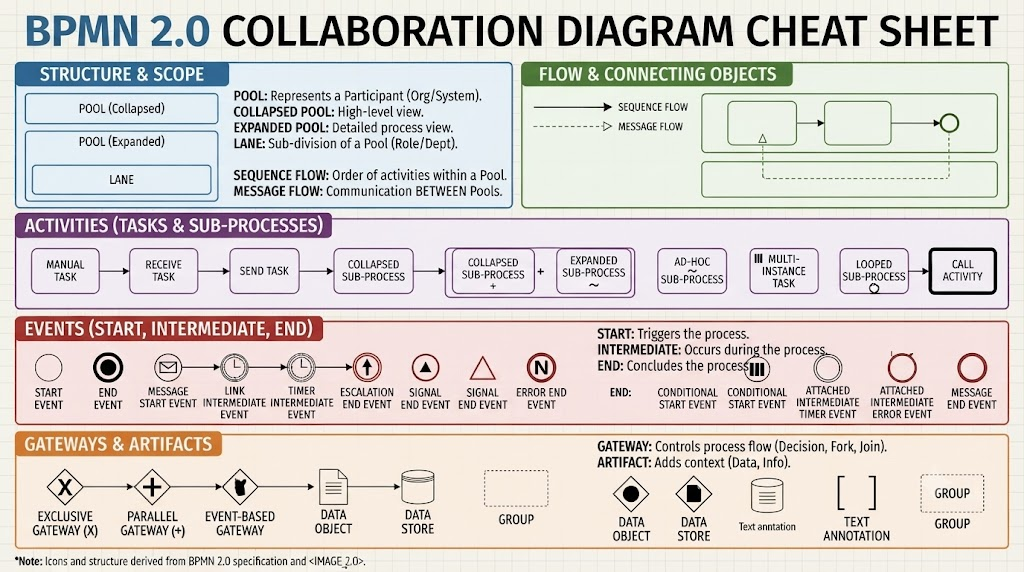
In the world of business process modeling, clarity is king. The Business Process Model and Notation (BPMN) 2.0 standard provides a universal language for describing workflows, but mastering its syntax is essential for creating diagrams that are both technically accurate and easily understood by stakeholders. This guide breaks down the core components of a BPMN Collaboration Diagram, transforming the visual “cheat sheet” of symbols into a structured understanding of system architecture and process logic.
1. Structure & Scope: Defining the Participants
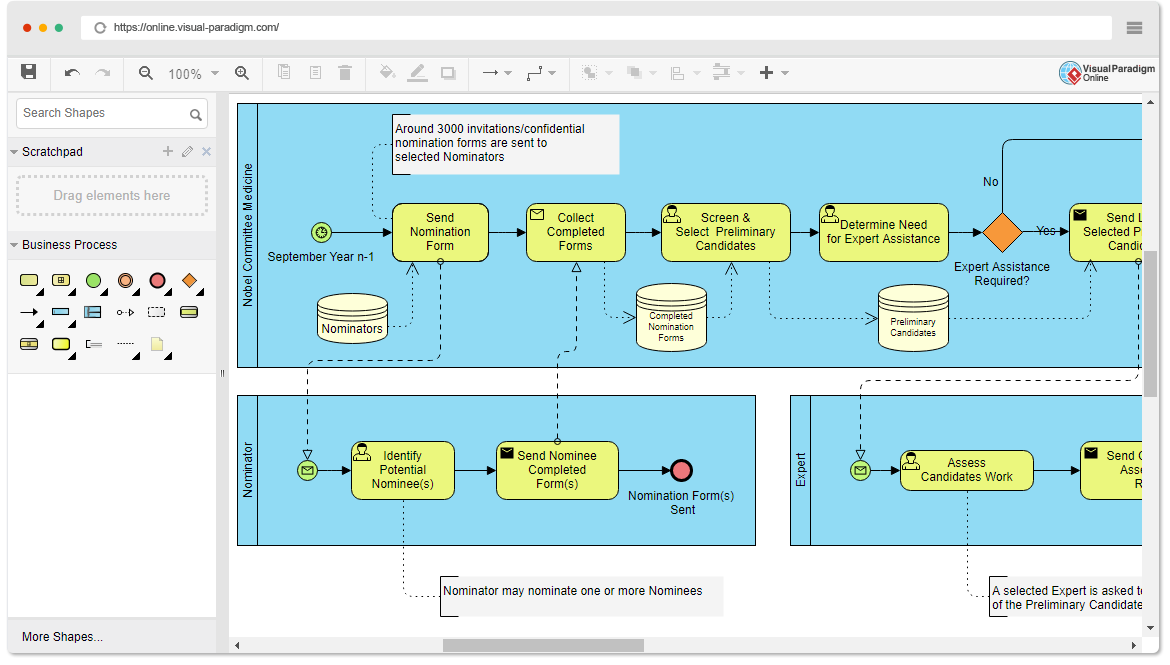
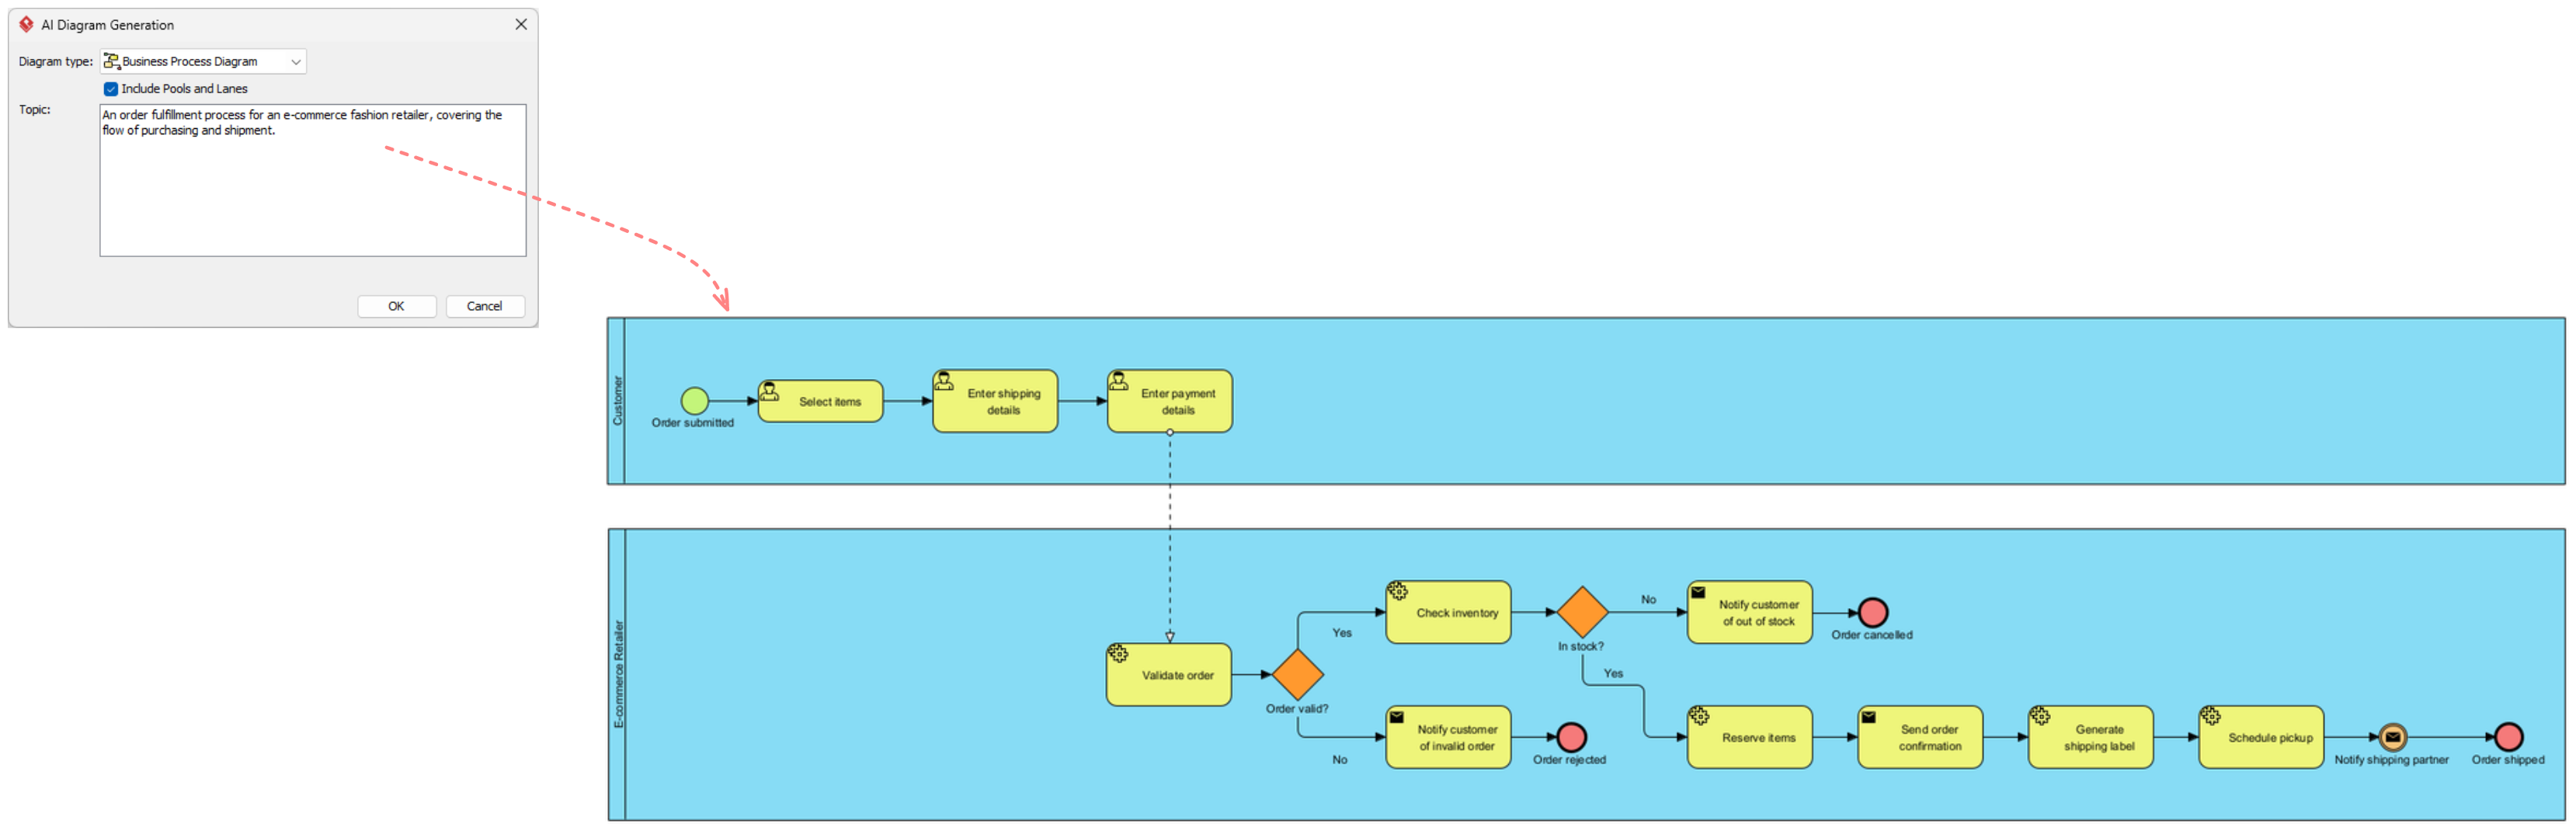
Before drawing a single line, you must define the scope of your model. A Collaboration Diagram specifically focuses on the interaction between different entities. In BPMN, this structure is built using Pools and Lanes.
- Pool: Represents a major participant in the process, such as an Organization, a System, or an external Party. Think of a Pool as the “container” for a specific entity’s responsibilities.
- Collapsed Pool: Used for a high-level view where the internal details are hidden.
- Expanded Pool: Used when you want to show the detailed internal process flow within that participant.
- Lane: A sub-division within a Pool. Lanes represent roles, departments, or specific actors (e.g., “Customer,” “Sales Dept,” “Bank System”). They organize the flow of activities vertically or horizontally.
2. Flow & Connecting Objects: The Movement of Logic
Once the structure is set, you connect the elements. BPMN distinguishes between two primary types of flow, and confusing them is a common modeling error.
- Sequence Flow: Represented by a solid line with a solid arrowhead. This indicates the order of activities within a single Pool (internal logic). It dictates that one task must finish before the next begins.
- Message Flow: Represented by a dashed line with an open circle at the start and an open arrow at the end. This indicates communication BETWEEN Pools. It signifies a message, document, or hand-off passing from one participant to another.
3. Activities: Tasks and Sub-Processes
Activities represent the “work” being done. BPMN 2.0 offers granular control over the type of work being performed.
Basic Tasks
- Manual Task: Represents work that must be performed by a human, but the system does not specify exactly how (e.g., “Review Document”).
- Receive Task: A task where the actor waits for a message or signal before proceeding.
- Send Task: A task where the actor actively sends a message or signal to another party.
Complex Activities
- Sub-Process: A container that encapsulates a detailed sequence of tasks.
- Collapsed Sub-Process: Shows only the start and end, hiding the complexity inside.
- Expanded Sub-Process: Unfolds to show the detailed steps within.
- Call Activity: A reference to a process defined elsewhere. This promotes reusability; you can call a standard “Onboarding Process” from multiple different main processes.
- Multi-Instance Task: Indicates that a task will be performed multiple times (e.g., processing 100 orders) based on a specific condition or list of items.
4. Events: The Triggers and Outcomes
Events are represented by circles. They do not have duration; they happen at a point in time. The border thickness and the icon inside the circle define the event’s nature.
Start, Intermediate, and End
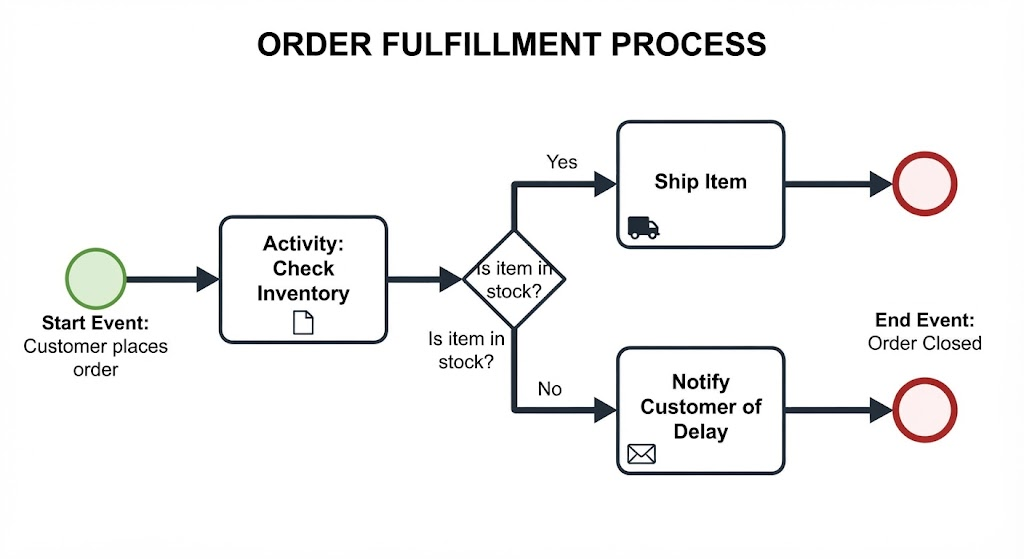
- Start Event: The trigger that initiates the process (thin circle). It can be a Message (email), Timer (scheduled time), or Signal (broadcast).
- Intermediate Event: Occurs during the process (double circle border). It acts as a pause or a catch point (e.g., waiting for a file upload or a timer expiration).
- End Event: Concludes the process or a specific path (thick circle). It represents the successful outcome or an error termination.
Event Markers
Notice the icons inside the circles in the diagram. These markers add specific context:
- Timer: A clock icon. Used for delays or scheduled triggers.
- Message: An envelope icon. Used for communication events.
- Signal: A triangle. Used for internal system signals.
- Error: An “N” or “X”. Used to indicate that a process failed or an exception occurred.
5. Gateways & Artifacts: Logic and Context
Not everything in a diagram is a task. Some elements control the flow (Gateways), while others add context without executing (Artifacts).
Gateways (The Decision Makers)
Gateways are diamond shapes that control the divergence and convergence of the flow.
- Exclusive Gateway (X): Represents a decision point (e.g., “If Yes, go left; If No, go right”). Only one path is taken.
- Parallel Gateway (+): Represents a split or join where all paths happen simultaneously (e.g., Send email AND print invoice).
- Event-Based Gateway: Waits for one of several events to occur (e.g., Wait for either a “Payment” or a “Cancellation”).
Artifacts (The Context)
Artifacts provide information about the process but do not affect the flow directly.
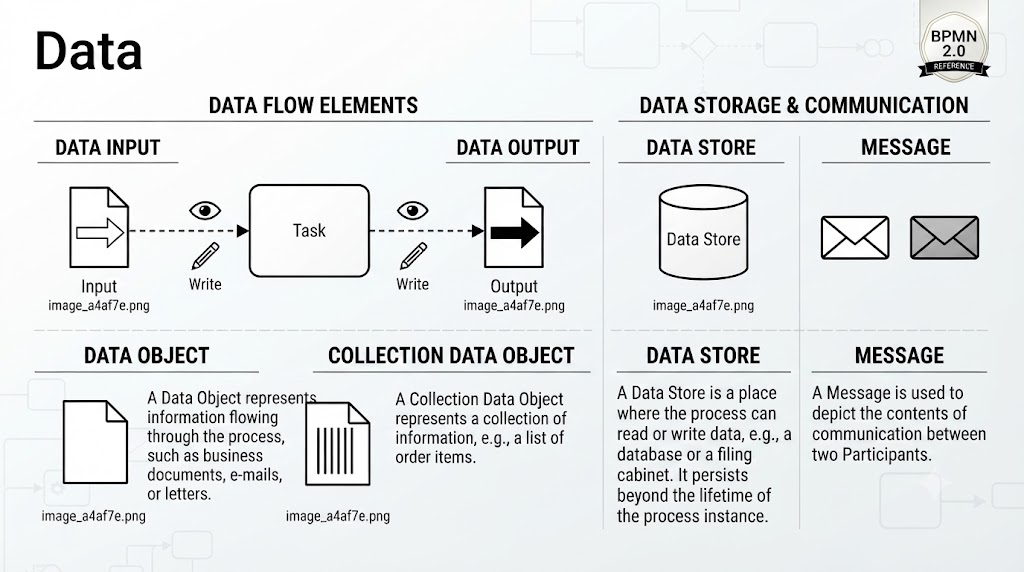
- Data Object: A piece of paper icon representing information used or produced by a task.
- Data Store: A cylinder icon representing a database or file repository where data is stored long-term.
- Group: A dashed box used to visually group elements together without implying a logical connection.
- Text Annotation: A note icon used to add comments or explanations to the model.
By mastering these symbols, you move beyond simple drawing to true architectural modeling. Whether you are using a tool like Visual Paradigm or drawing by hand, understanding the distinction between a Sequence Flow and a Message Flow, or when to use a Collapsed Sub-Process versus an Expanded Pool, is the key to creating diagrams that drive business efficiency.