


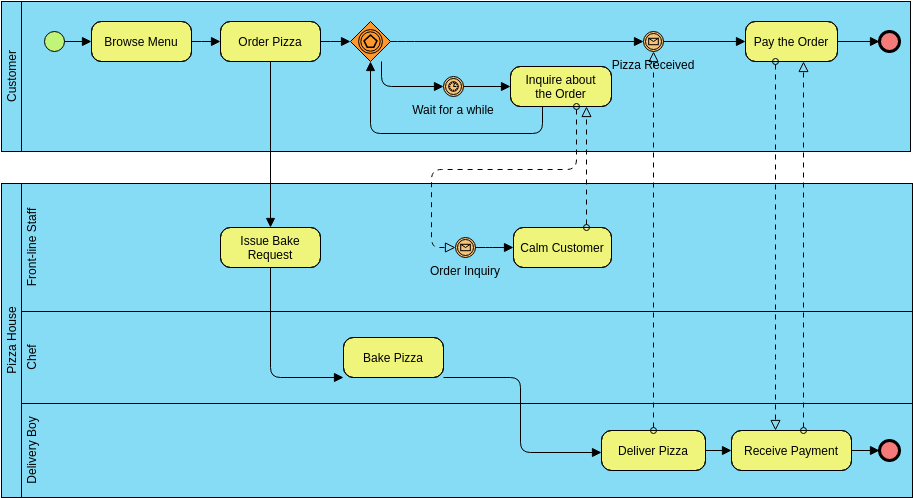
Welcome to this comprehensive tutorial on Business Process Model and Notation (BPMN). In the world of business analysis and software architecture, visualizing complex workflows is crucial. Today, we will dissect a real-world BPMN diagram representing a Pizza Delivery System. This guide will walk you through the system architecture, explain the specific symbols used, and trace the logic of the process from the customer’s initial browse to the final payment.
Understanding the Architecture: Pools and Lanes
Before diving into the steps, we must understand the “container” of our process. The diagram uses a structure known as Pools and Lanes, which is fundamental to BPMN 2.0.
- The Pool: The entire blue rectangular area represents the process itself. It defines the scope of the business activity.
- The Lanes: The horizontal subdivisions within the pool represent different participants or roles responsible for specific tasks. In this diagram, we have four distinct lanes:
- Customer: The external actor initiating the process.
- Front-line Staff: The reception or order-taker role handling customer interaction.
- Chef: The production role responsible for making the product.
- Delivery Boy: The logistics role responsible for fulfillment and payment collection.
This separation is vital for Responsibility Assignment. It clearly shows that the Chef does not talk to the customer directly; the Front-line Staff acts as the bridge.
Decoding the Symbols: A Visual Glossary
BPMN relies on a standardized set of icons. Here is a breakdown of the key elements found in this specific diagram:
1. Start and End Events
- Start Event (Green Circle): Located at the top left, this signifies the trigger of the process. In this case, the process begins when the customer opens the menu.
- End Event (Red Circle): Located at the top right and bottom right, these signify the successful completion of the workflow (e.g., payment received).
2. Activities (Tasks)
- Yellow Rounded Rectangles: These represent actions. They can be simple (like “Browse Menu”) or complex subprocesses. For example, “Order Pizza” is a high-level task that might involve multiple sub-steps not shown here.
3. Gateways (Decision Points)
The diamond shape is the most critical logic element. This specific diagram features a Complex/Event-Based Gateway (the diamond with the star/hexagon pattern). Unlike a simple “Yes/No” decision, this gateway waits for a specific event to occur. It splits the flow into parallel paths, but only one will be taken based on what happens next.
4. Intermediate Events
The circles with icons inside represent events that happen during the process, not just at the start or end.
- Timer Event (Clock Icon): Represents a time-based trigger. For example, “Wait for a while.”
- Message Event (Envelope Icon): Represents communication. For example, “Pizza Received” or “Order Inquiry.”
5. Connecting Objects
- Sequence Flow (Solid Arrow): Shows the order of activities within the same lane or participant.
- Message Flow (Dashed Arrow): Shows communication between different lanes. This is how the Customer talks to the Staff, or the Chef talks to the Delivery Boy.
Step-by-Step Process Walkthrough
Now that we understand the symbols, let’s trace the flow of the pizza delivery process logically.
Phase 1: The Customer Journey
The process begins in the Customer lane. The user performs two simple tasks:
- Browse Menu: The customer views available items.
- Order Pizza: The customer places the order. This task acts as a trigger for the rest of the system.
Once the order is placed, the flow hits the Event-Based Gateway. The system now enters a waiting state. It branches into two potential scenarios:
- Scenario A (Normal Flow): The pizza is delivered and received. The event “Pizza Received” is triggered.
- Scenario B (Exception/Delay Flow): The customer waits too long. The “Wait for a while” timer triggers.
Phase 2: The Kitchen and Delivery Operations
While the customer is waiting, the other lanes are working. This is a parallel process. The “Order Pizza” task sends a Message Flow (dashed line) to the Front-line Staff lane.
- Front-line Staff: Upon receiving the order, they “Issue Bake Request” to the kitchen.
- Chef: The request is sent to the Chef lane. The chef performs the task “Bake Pizza”.
- Delivery Boy: Once the pizza is baked, it is passed to the Delivery Boy. The task is “Deliver Pizza”.
Phase 3: Handling Delays and Inquiries
This is where the diagram gets sophisticated. The Front-line Staff lane has a specific loop for handling customer anxiety.
- If the customer triggers the “Wait for a while” timer (Scenario B from Phase 1), they perform the task “Inquire about the Order”.
- This inquiry is sent via a Message Flow to the Front-line Staff.
- The Staff then performs “Calm Customer”.
- Simultaneously, the Delivery Boy delivers the pizza and triggers the “Pizza Received” message event back to the customer.
Once the “Pizza Received” event occurs, the process converges. The customer proceeds to “Pay the Order”. This payment request is sent to the Delivery Boy (via a dashed line), who performs “Receive Payment”, finally triggering the End Event.
Why This Matters: Automation and Optimization
Visualizing this process is not just about drawing pretty pictures. This diagram serves several critical business functions:
- Automation: The “Event-Based Gateway” logic is perfect for automation. A software system can easily be programmed to send an SMS notification (the “Wait for a while” timer) if the status hasn’t updated to “Pizza Received” within 30 minutes.
- Communication: It eliminates ambiguity. The Chef knows exactly when to bake, and the Delivery Boy knows exactly when to collect the food.
- Efficiency: By visualizing the “Inquire” loop, the business can see where bottlenecks occur. If customers frequently trigger the “Wait for a while” event, the kitchen needs to speed up.
By mastering these BPMN concepts, you gain the ability to design robust, efficient, and automated business systems.
Related posts:
 Understanding Mortgage Application Flows with BPMN
 Understanding Process Improvement: An “As-Is” Analysis of Apex Manufacturing Inc.
 Mastering BPMN Collaboration: A Guide to Cross-Platform Modeling with Visual Paradigm Online
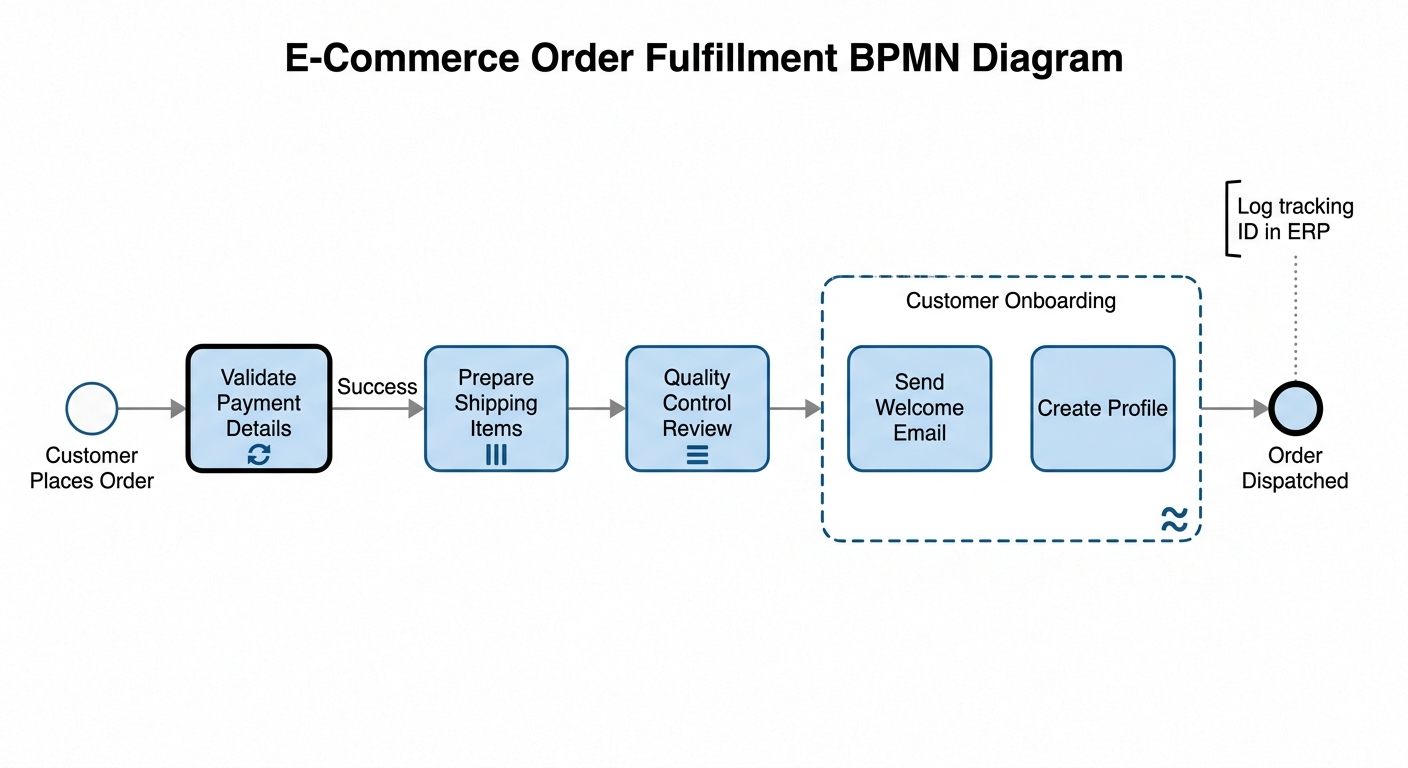 Mastering BPMN Markers: A Technical Deep Dive into E-Commerce Order Fulfillment