


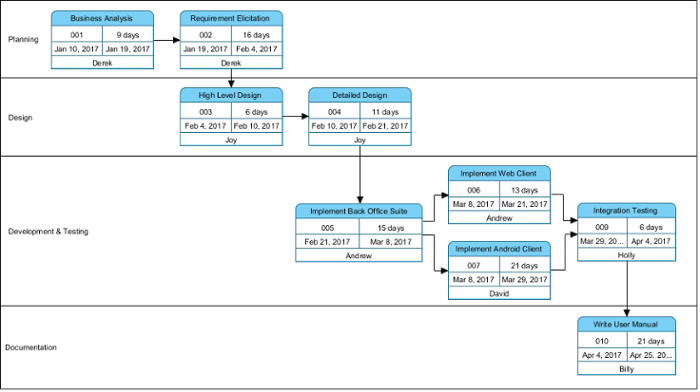
In the complex world of project management, visualizing the sequence of events is crucial for success. One of the most powerful tools for this is the PERT chart (Project Evaluation and Review Technique). This guide will walk you through the anatomy and logic of a PERT chart, using a comprehensive example that spans planning, design, development, and documentation phases.
What is a PERT Chart?
A PERT chart is a schematic representation of a project. It breaks the project down into individual tasks and illustrates the dependencies between them. Unlike a simple Gantt chart which focuses heavily on time bars, a PERT chart focuses on the relationships and flow of the project. It helps project managers identify the critical path—the longest stretch of dependent activities—and measure the time required to complete the entire project.
Anatomy of a Task Node
In the diagram provided, each task is represented by a rectangular node (the blue boxes). Understanding the data within these nodes is the first step to reading the chart effectively. A standard task node typically contains five key pieces of information:
- Task ID: A unique identifier for the task (e.g.,
001,002). - Task Name: A brief description of the work to be done (e.g., “Business Analysis”).
- Duration: The estimated time required to complete the task (e.g.,
9 days). - Start and End Dates: The projected timeline for the task (e.g.,
Jan 10, 2017toJan 19, 2017). - Resource: The person or team responsible for the task (e.g.,
Derek,Joy,Andrew).
Visualizing Phases: The Swimlane Structure
The chart provided utilizes a swimlane layout, which is a common technique in process mapping and project management. The chart is divided horizontally into four distinct sections, representing the major phases or departments of the project:
- Planning: The initial phase where requirements are gathered.
- Design: The phase where the system architecture is defined.
- Development & Testing: The core execution phase where the software is built and validated.
- Documentation: The final phase where user guides and manuals are created.
This structure allows stakeholders to quickly see which team is responsible for which part of the project and how the work flows between different departments.
Tracing the Workflow and Dependencies
The arrows connecting the nodes represent dependencies. They indicate that one task cannot start until the previous one is finished. Let’s trace the logical flow of the project shown in the diagram:
1. The Planning Phase
The project begins with Task 001: Business Analysis. Once Derek completes this 9-day task, the flow moves immediately to Task 002: Requirement Elicitation. This linear progression ensures that requirements are fully understood before moving forward.
2. The Design Phase
Once requirements are elicited, the project moves down to the Design lane. It starts with Task 003: High Level Design, followed by Task 004: Detailed Design. This sequential flow indicates that the team cannot finalize specific details until the high-level architecture is approved.
3. Parallel Processing in Development
This is where the chart becomes particularly insightful. After the Detailed Design is complete, the project splits into parallel tracks:
- Task 005: Implement Back Office Suite (15 days).
- Task 006: Implement Web Client (13 days).
- Task 007: Implement Android Client (21 days).
This branching structure signifies parallel processing. Andrew and David can work on these different components simultaneously. This significantly reduces the overall project duration compared to doing them one by one.
4. Convergence and Integration
Notice that all three development tasks (005, 006, and 007) eventually point toward a single node: Task 009: Integration Testing. This is a critical convergence point. It implies that Integration Testing cannot begin until all three components (Back Office, Web Client, and Android Client) are fully implemented and ready for testing. The project manager must ensure that the longest development task (Android Client) is completed before testing can commence.
5. Final Deliverables
Finally, after testing is complete, the flow moves to the Documentation phase for Task 010: Write User Manual, completing the project lifecycle.
Key Takeaways for Project Managers
By analyzing this PERT chart, a project manager can instantly identify:
- Critical Resources: Who is busy when? (e.g., Joy is busy during the Design phase).
- Bottlenecks: The “Implement Android Client” task is the longest (21 days), making it a potential bottleneck for the Integration Testing phase.
- Timeline Accuracy: By summing the durations along the longest path (Critical Path), the manager can predict the exact project finish date.
Tools like Visual Paradigm allow teams to visualize these complex relationships, ensuring that every stakeholder understands not just what needs to be done, but when and how it connects to the rest of the project.
Related posts:
 Mastering Project Scheduling: A Comprehensive Guide to Enhanced PERT Charts in Visual Paradigm
 Mastering Project Management: Integrating RACI Models into PERT Charts with Visual Paradigm
 From PERT Charts to Action: Mastering Task Synchronization in Visual Paradigm
 Mastering Project Scheduling: A Step-by-Step Guide to Enhanced PERT Charts for Task Automation