


Project management is the art of balancing time, resources, and scope to achieve specific goals. Among the most powerful tools for visualizing these complex relationships is the PERT chart (Program Evaluation and Review Technique). In the modern enterprise environment, tools like Visual Paradigm have evolved this classic methodology into an “Enhanced PERT Chart” that integrates deeply with broader software development and business analysis frameworks.
This guide will deconstruct the architecture of an Enhanced PERT Chart, using the “BeeMall” project screenshot as a practical case study. We will explore how to structure your project, assign responsibilities, and visualize dependencies to ensure successful delivery.
1. The Anatomy of an Enhanced Task Node
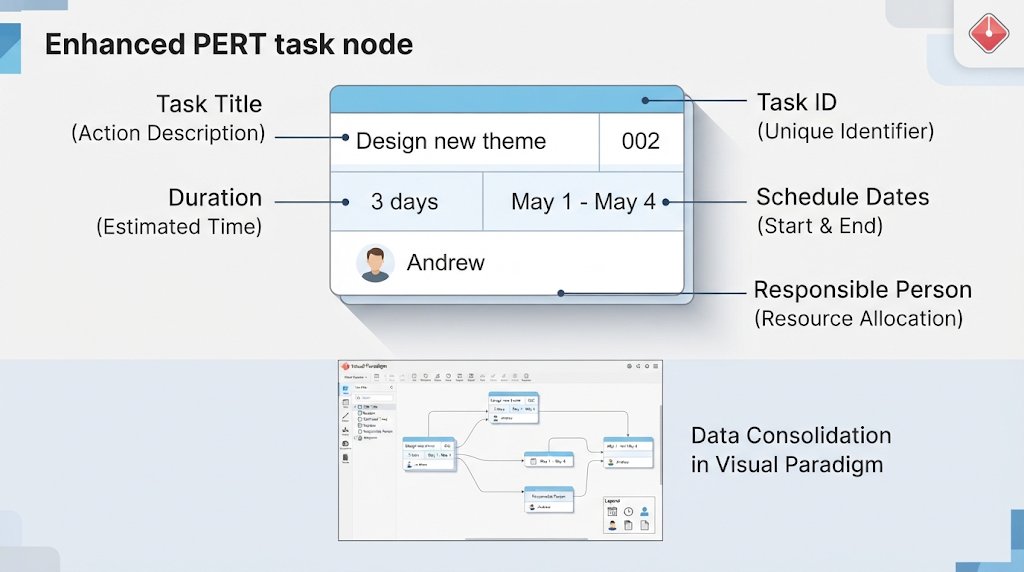
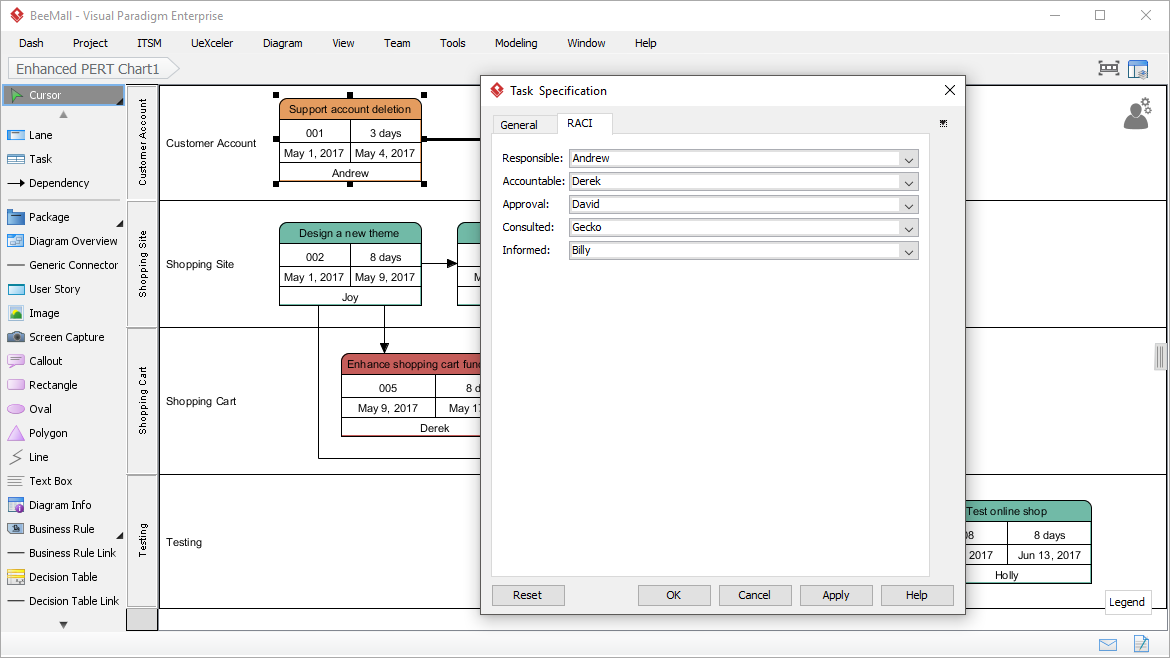
At the heart of any PERT chart are the task nodes. In the Visual Paradigm Enhanced model, these are not simple rectangles; they are data-rich containers that serve as the primary unit of work tracking. Looking at the diagram provided, we can identify four distinct data fields within each task box:
- Task Title: The top section describes the action (e.g., “Design a new theme” or “Support account deletion”).
- Task ID: A unique identifier (e.g., 001, 002, 005) used for tracking and reporting.
- Duration: The estimated time required to complete the task (e.g., “3 days”, “8 days”).
- Schedule Dates: The calculated Start and End dates. In the image, you can see Task 001 runs from May 1, 2017 to May 4, 2017.
- Responsible Person: The bottom field assigns ownership (e.g., Andrew, Joy, Bosco).
Why This Matters
By combining schedule data with resource allocation in a single visual element, the Enhanced PERT chart eliminates the need to cross-reference separate spreadsheets. It answers the critical questions: What needs to be done? How long will it take? When will it happen? Who is doing it?
2. Organizing Complexity with Swimlanes
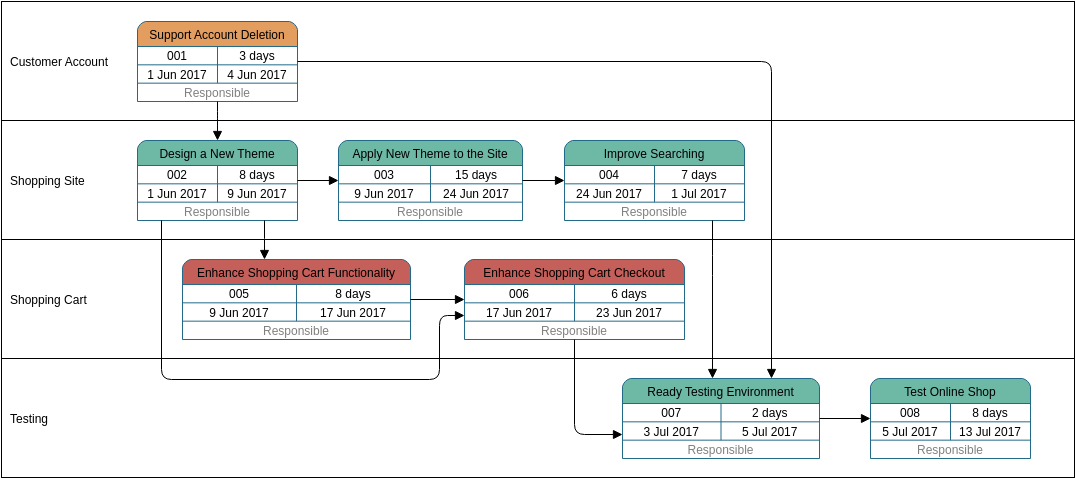
The most striking feature of the diagram above is the use of horizontal bands, known as Swimlanes. In the context of the BeeMall project, these lanes are labeled: Customer Account, Shopping Site, Shopping Cart, and Testing.
Functional Decomposition
Swimlanes provide a visual mechanism for functional decomposition. Instead of a chaotic list of tasks, the chart organizes work by department, system module, or role. This offers several benefits:
- Clarity of Ownership: It is immediately obvious which functional area is responsible for a specific task. For example, “Enhance shopping cart functionality” is clearly placed in the Shopping Cart lane.
- Parallel Processing: Stakeholders can see which tasks can happen simultaneously. Notice that the Customer Account tasks (top lane) run somewhat parallel to the Shopping Site development tasks.
- Handoff Visualization: Dependencies that cross lane boundaries (like the arrow going from the Shopping Site lane down to the Shopping Cart lane) clearly indicate a handoff or a dependency between different teams.
3. Modeling Logic: Dependencies and Flow
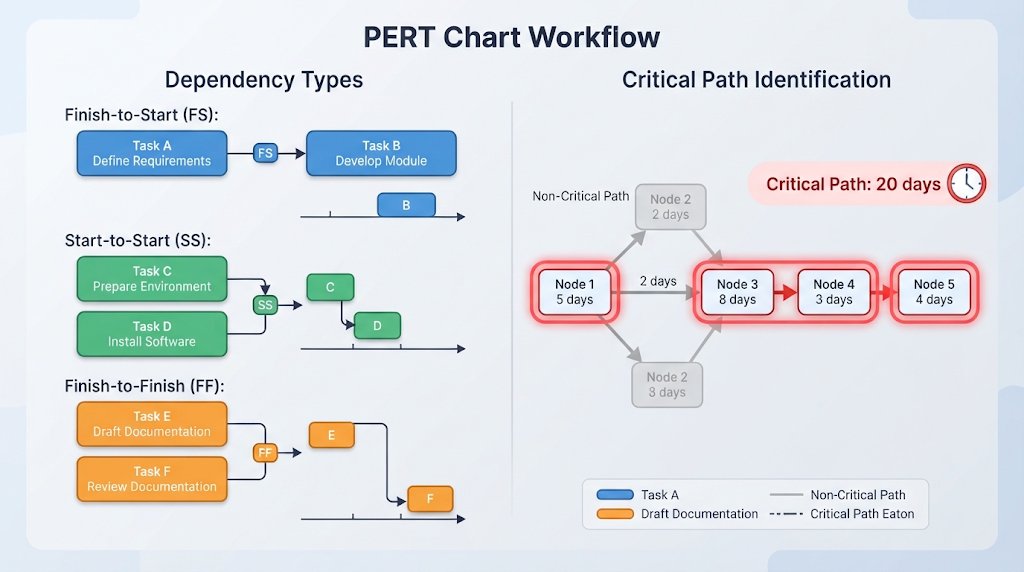
A PERT chart is a graph, meaning the relationships between nodes are just as important as the nodes themselves. The arrows connecting the task boxes represent Dependencies.
Sequential Logic
In the image, observe the flow within the Shopping Site lane:
- Task 002 (Design a new theme) must finish.
- This triggers Task 003 (Apply new theme to the site).
- Which triggers Task 003 (likely a typo in the source, meant to be 004) (Improve searching).
Cross-Lane Dependencies
Look at the connection between the Shopping Site and Shopping Cart lanes. A line extends from the bottom of Task 002 (“Design a new theme”) down to Task 005 (“Enhance shopping cart functionality”). This implies that the design of the theme might be a prerequisite for enhancing the cart, or perhaps the cart enhancement is scheduled to begin once the site design is finalized.
4. Advanced Integration: The “Enhanced” Features
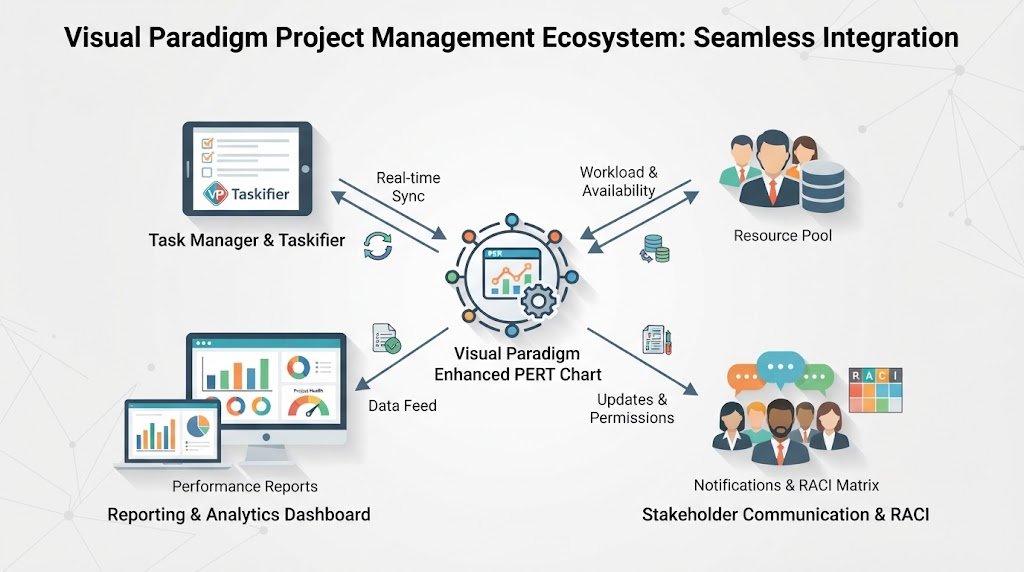
While the image shows basic scheduling, the context provided highlights that the Enhanced PERT Chart tool adds four specific layers of sophistication. These features transform a simple timeline into a robust project management model.
- Selection of Responsible Person: As seen in the diagram, every task is explicitly linked to a user (e.g., David, Bosco). This allows for resource leveling and workload analysis.
- Task-based RACI: The tool supports Responsible, Accountable, Consulted, and Informed matrices. This allows you to define not just who does the work, but who must approve it (Accountable) or who needs to be updated (Inform).
- Task to Task Manager Integration: The prompt mentions “Visual Paradigm Tasifier.” This implies that tasks created in the PERT chart can be synchronized with a dedicated Task Manager, allowing for status updates and time tracking without leaving the modeling environment.
- Automated RACI in Task Manager: This feature automates the distribution of RACI data, ensuring that project stakeholders receive the correct notifications and permissions based on the model.
5. Case Study Analysis: The BeeMall Timeline
Let’s walk through the critical path logic visible in the screenshot to understand the project schedule.
The Development Phase
The project appears to kick off with “Support account deletion” (Task 001) in the Customer Account lane. Simultaneously, the core development begins in the Shopping Site lane with “Design a new theme” (Task 002).
The Integration Phase
Once the theme is designed, the work flows down. Task 002 feeds into Task 005 (“Enhance shopping cart functionality”) and Task 006 (“Enhance shopping cart checkout”). This suggests a modular approach where the UI design dictates the functionality of the cart.
The Testing Phase
Finally, the project converges in the Testing lane. Both the cart enhancements and the site updates must be complete before “Ready testing environment” (Task 007) can begin. Once the environment is ready, the final step is “Test online shop” (Task 008), which concludes the project timeline shown in this view, ending on June 13, 2017.
Conclusion
The Enhanced PERT Chart in Visual Paradigm bridges the gap between high-level architectural planning and detailed task management. By utilizing swimlanes for organization, rich data nodes for scheduling, and dependency arrows for logic, project managers can create a living document that accurately reflects the complexity of software development projects like BeeMall.
Related posts:
 Mastering Project Scheduling: An In-Depth Guide to PERT Charts and Network Diagrams
 Mastering Project Management: Integrating RACI Models into PERT Charts with Visual Paradigm
 From PERT Charts to Action: Mastering Task Synchronization in Visual Paradigm
 Mastering Project Scheduling: A Step-by-Step Guide to Enhanced PERT Charts for Task Automation