


In the realm of Project Management, the gap between high-level planning and daily execution can often be a source of confusion and lost productivity. How do you ensure that the complex dependencies visualized in a PERT (Program Evaluation and Review Technique) chart translate seamlessly into actionable items for your team members? This tutorial explores the powerful workflow of synchronizing a PERT Chart with a Task Manager, using the Visual Paradigm environment as our case study.
Understanding the Architecture: Planning vs. Execution
The system architecture illustrated in the interface relies on two distinct but interconnected views:
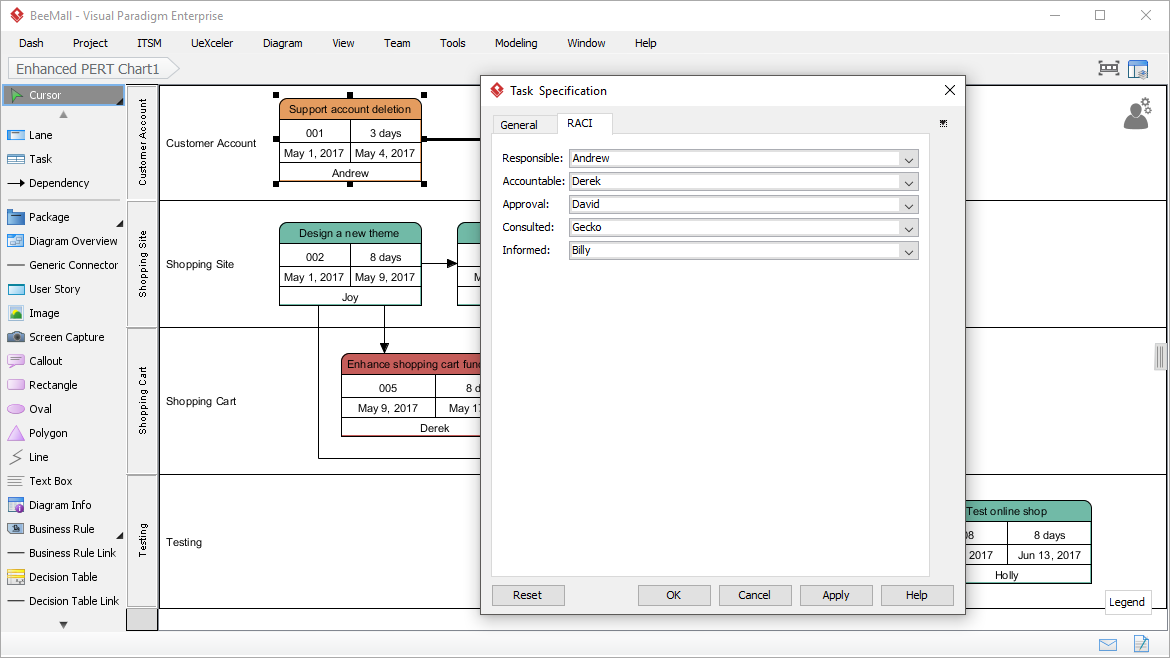
- The PERT Chart (Background): This is the strategic layer. It visualizes the project timeline, critical paths, and dependencies. In the image, we see distinct nodes like “Support account deletion” and “Design a new theme”, each with specific durations and assigned resources (e.g., Andrew, Joy).
- The Task Manager (Foreground): This is the tactical layer. It is the interface where team members interact with their daily workload. It breaks down the abstract nodes from the PERT chart into concrete, manageable tasks.
Step 1: The Enhanced PERT Chart
The process begins with the creation of the schedule baseline. As shown in the background of the interface, the Enhanced PERT Chart allows for detailed scheduling. Each node represents a major activity or a pool of tasks. You can see specific attributes defined within these nodes:
- Duration: For example, “Design a new theme” is scheduled for 8 days.
- Timeline: Start and end dates are clearly marked (May 1, 2017 – May 9, 2017).
- Resource Allocation: The chart explicitly assigns responsibility. The node “Design a new theme” is assigned to Joy.
Synchronizing the Workflow
The magic of this system lies in the synchronization feature. Once the schedule baseline is established, you do not need to manually recreate tasks. The system automatically generates tasks and assigns them to the corresponding members based on the PERT chart data.
Step 2: The Task Manager Interface
When you open the Task Manager, you are presented with a structured view of your project’s progress. The interface is divided into logical sections:
- Task Pool Management: The top section allows you to manage “Planned Tasks.” This is where you organize the work before it becomes active. A helpful notification system guides the user, reminding them to click the (kick off) button to start a task pool.
- Active Tasks: The list below shows the “5 active tasks.” This provides a real-time snapshot of what is currently being worked on. You can see tasks like “Apply new theme to the site” and “Improve searching”.
- Task Details Panel: On the right side of the interface, a detailed pane provides context for specific tasks. For the selected task “Design a new theme,” the panel displays:
- Subject: The name of the task.
- Role/Responsible: A dropdown to assign or change the person responsible (e.g., Joy).
- Progress Tracking: A
Complete: 0%field allows for real-time status updates. - Description & Requirements: Detailed instructions are stored here. For the theme design task, specific requirements are listed: Font selection, Color tone, The way to obtain resources, and Mock-up.
Step 3: Assigning Responsibility
One of the most critical aspects of project management is clarity of ownership. The interface simplifies this through the Role dropdown. When a user creates a new task or edits an existing one from the PERT chart, they can immediately assign a “Responsible” party. This ensures that every node in the diagram has a human owner.
The system also tracks submission and assignment history. As seen in the details panel, you can see notes like “Submitted by Derek” and “Derek assigned to Joy,” providing a clear audit trail of how tasks move through the workflow.
Conclusion: Bridging the Gap
By integrating the visual power of a PERT chart with the operational utility of a Task Manager, teams can maintain a clear line of sight from the project’s high-level strategy to the individual’s daily to-do list. This synchronization ensures that when a node is completed in the chart, the corresponding tasks are marked as done in the manager, keeping the entire team aligned and informed.
Related posts:
 Mastering Project Scheduling: An In-Depth Guide to PERT Charts and Network Diagrams
 Mastering Project Scheduling: A Comprehensive Guide to Enhanced PERT Charts in Visual Paradigm
 Mastering Project Management: Integrating RACI Models into PERT Charts with Visual Paradigm
 Mastering PERT Charts: A Guide to Swimlanes and Responsibility Mapping