


In the realm of project management, the Program Evaluation and Review Technique (PERT) chart is a fundamental tool used to schedule, organize, and coordinate tasks within a project. However, as projects grow in complexity, a standard linear list of tasks often fails to capture the nuances of who is doing what. This is where the concept of Lanes in Enhanced PERT Charts comes into play, transforming a simple timeline into a powerful matrix of responsibility.
This tutorial explores the system architecture of Enhanced PERT charts, specifically focusing on the “Lane” feature found in tools like Visual Paradigm. We will break down how these charts model complex workflows, assign responsibilities, and visualize dependencies.
Understanding the Concept of Lanes
Imagine a swimming pool divided into vertical strips by ropes. Each swimmer stays in their own lane. In project modeling, this concept is known as a Swimlane Diagram or, in the context of PERT charts, simply a Lane.
Definition and Purpose
A lane allows you to partition your PERT chart into horizontal zones separated by lines. Each zone represents the responsibilities of a particular class, worker, department, or concept. By grouping tasks into these zones, you achieve two critical modeling goals:
- Partitioning: You clearly separate tasks based on categories like the party responsible for them.
- Contextualization: It becomes immediately obvious which team or functional area owns a specific milestone.
Walkthrough: Analyzing the Diagram
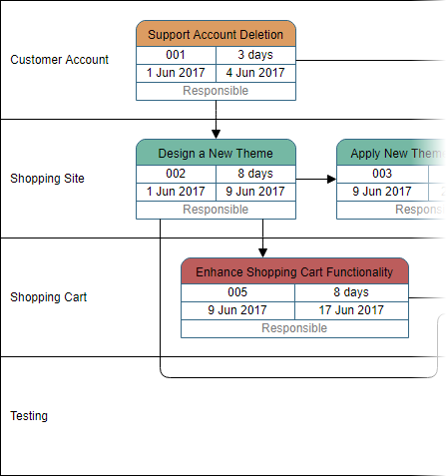
To understand how this works in practice, let us analyze the provided diagram. This visual representation demonstrates a project workflow involving multiple functional areas, each contained within its own horizontal lane.
1. The “Customer Account” Lane
The top zone is labeled Customer Account. This lane contains a single task:
- Task 001: Support Account Deletion
- Duration: 3 days
- Timeline: 1 Jun 2017 to 4 Jun 2017
This indicates that the account management team is responsible for the initial setup or cleanup phase of the project.
2. The “Shopping Site” Lane
The second zone, Shopping Site, handles the core development work. It contains two distinct tasks:
- Task 002: Design a new Theme
- Duration: 8 days
- Timeline: 1 Jun 2017 to 9 Jun 2017
- Task 003: Apply New Theme
- Duration: Not explicitly stated in the box, but follows Task 002.
- Timeline: 9 Jun 2017 to (implied end date)
Notice the dependency arrow pointing from Task 002 to Task 003. This signifies a sequential relationship: the theme must be designed before it can be applied.
3. The “Shopping Cart” Lane
The third zone, Shopping Cart, represents a parallel or subsequent workstream. It contains:
- Task 005: Enhance Shopping Cart Functionality
- Duration: 8 days
- Timeline: 9 Jun 2017 to 17 Jun 2017
Crucially, observe the arrow originating from Task 002 (“Design a new Theme”) and pointing down into this lane to Task 005. This indicates a cross-lane dependency. The shopping cart enhancement cannot begin until the theme design is complete, even though the work is being done by a different team (or class).
4. The “Testing” Lane
The bottom zone is labeled Testing. Currently, this zone is empty, suggesting that the testing phase has not yet been scheduled or broken down into specific tasks within this view. However, its presence establishes the framework for where quality assurance tasks will eventually reside.
Advanced Features: Automated Task Assignment
While Lanes provide the visual structure, Enhanced PERT Charts offer a backend integration feature known as Automated Task Assignment and Management. This feature links the visual nodes in your chart to the system’s Task Manager (often referred to as Tasifier in Visual Paradigm).
This integration allows project managers to:
- Assign Tasks: Drag and drop tasks from the chart directly to team members.
- Manage Progress: Update the status of a task in the chart, which automatically updates the underlying task list.
- Track Responsibility: The “Responsible” field visible in the bottom of each task box (e.g., below the dates in Task 001) is managed through this system.
Conclusion
By utilizing Lanes in a PERT chart, you move beyond simple time estimation to a holistic view of project execution. The diagram provided serves as a perfect example of how different functional areas—Customer Accounts, Site Design, and Cart Functionality—interact. The arrows connect these lanes, showing that while teams may work in parallel, their progress is often interdependent.
Mastering this modeling technique allows for clearer communication, reduced ambiguity regarding responsibilities, and a more robust project schedule.
Related posts:
 Mastering Project Scheduling: An In-Depth Guide to PERT Charts and Network Diagrams
 Mastering Project Scheduling: A Comprehensive Guide to Enhanced PERT Charts in Visual Paradigm
 From PERT Charts to Action: Mastering Task Synchronization in Visual Paradigm
 Mastering Project Scheduling: A Step-by-Step Guide to Enhanced PERT Charts for Task Automation