


In modern software engineering, the gap between documentation and development often leads to “documentation rot,” where diagrams become outdated the moment they are created. VPasCode (Visual Paradigm as Code) bridges this divide by allowing engineers to define complex system architectures using simple text scripts. This tutorial explores how to model a system context diagram for an E-Commerce platform using VPasCode, leveraging PlantUML syntax to create dynamic, version-controlled visual models.
1. The Philosophy: Modeling as Code
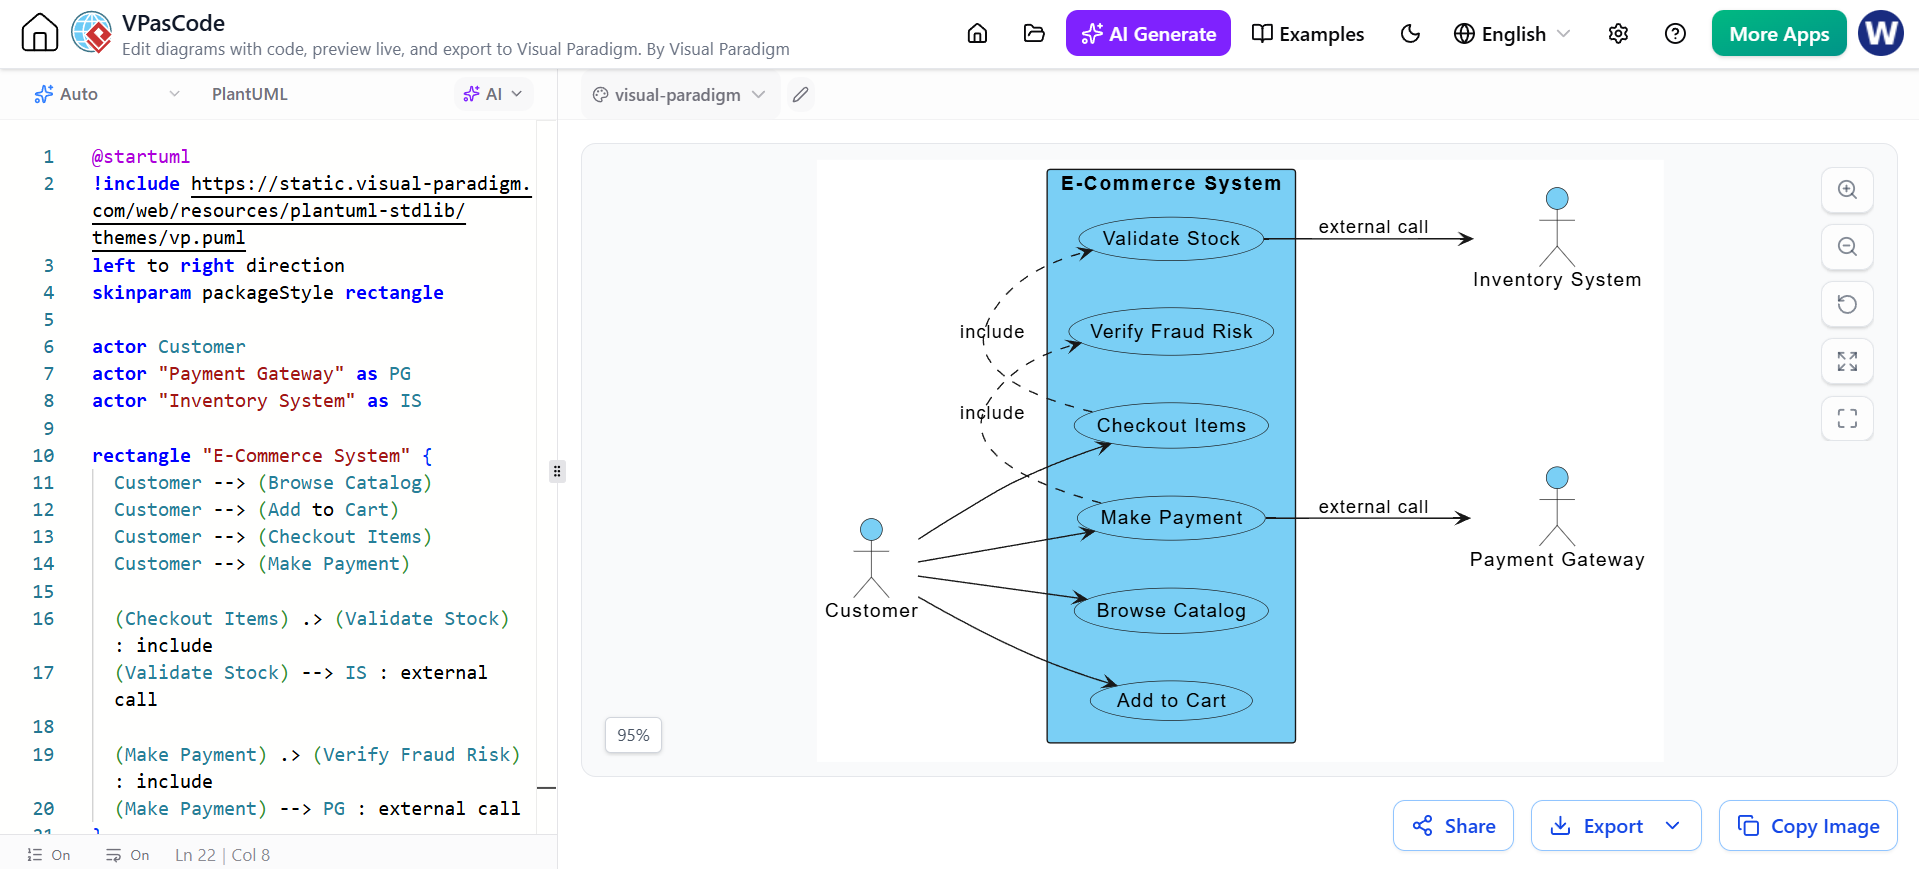
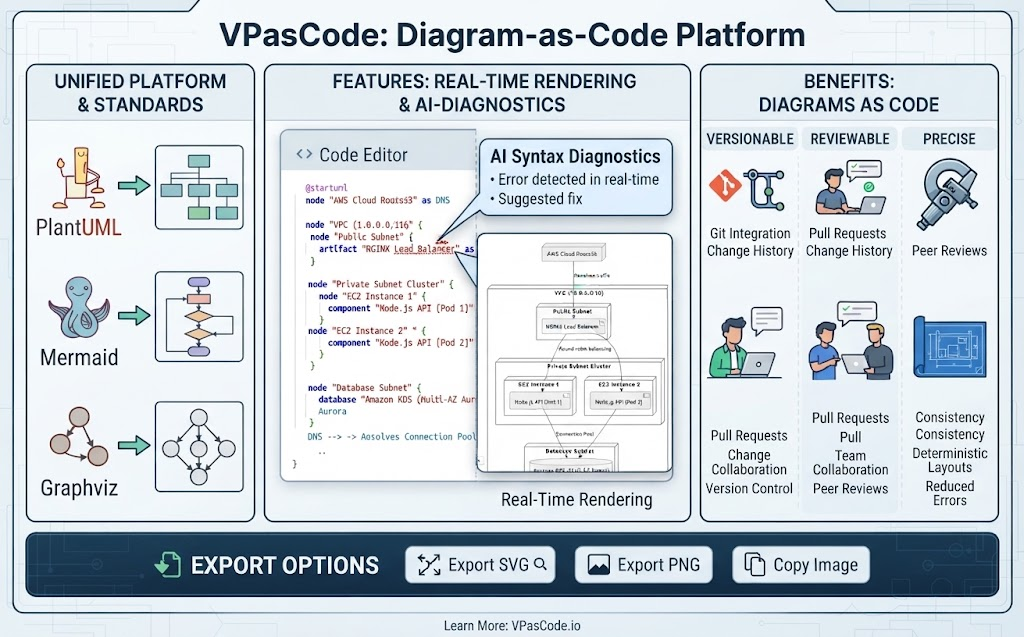
Traditional modeling tools rely on drag-and-drop interfaces, which can be cumbersome for version control and difficult to automate. VPasCode flips this paradigm. Instead of clicking icons, you write code. The interface shown in the image is split into two distinct areas:
- The Editor (Left): A syntax-highlighted code area where the logic of the diagram is written using PlantUML. This allows for Version Control—you can store your diagrams in Git alongside your application code.
- The Canvas (Right): A real-time rendering engine that instantly visualizes the code. This ensures Visual Fidelity and immediate feedback.
2. Deconstructing the Code
Let’s walk through the specific PlantUML script shown in the editor to understand how the E-Commerce System diagram is constructed.
Header and Styling
The script begins with configuration directives that set the stage for the diagram:
@startuml: The standard entry point for PlantUML.left to right direction: This directive dictates the flow of the diagram, positioning the system boundary in the center with actors flanking it.skinparam packageStyle rectangle: This ensures that the system boundary is rendered as a box (rectangle) rather than a rounded folder, providing a clear container for use cases.
Defining Actors
The code defines the entities interacting with the system:
 actor Customer
 actor "Payment Gateway" as PG
 actor "Inventory System" as IS
Here, we define three distinct actors. Customer is the primary human user, while PG (Payment Gateway) and IS (Inventory System) represent external systems that the E-Commerce platform must integrate with.
Creating the System Boundary
The core of a context diagram is defining what is inside the system and what is outside. The script uses a rectangle block to encapsulate the internal logic:
rectangle "E-Commerce System" { Customer --> (Browse Catalog) Customer --> (Add to Cart) ... }
Everything nested inside this rectangle represents a use case or process that occurs within the E-Commerce System’s domain.
3. Understanding the Relationships and Flows
The diagram illustrates complex interactions between the Customer and the system, as well as external dependencies. Here is how the logic translates visually:
Internal Workflows
Notice the solid arrows originating from the Customer. These represent direct actions initiated by the user, such as Browse Catalog, Add to Cart, and Make Payment. These are the primary entry points into the system.
Dependency Logic (Includes)
Not all actions are simple one-step processes. The diagram uses Include relationships to show mandatory sub-processes. For example:
- Checkout Logic: The script shows
(Checkout Items) .> (Validate Stock) : include. This means that before a checkout is finalized, the system must validate stock availability. - Payment Logic: Similarly,
(Make Payment) .> (Verify Fraud Risk) : includeindicates that fraud verification is a mandatory step within the payment process.
External System Calls
This is where the diagram demonstrates system integration. The code uses specific syntax to link internal use cases to external actors:
 (Validate Stock) --> IS : external call
 (Verify Fraud Risk) --> PG : external call
These dashed lines with the label external call indicate that the E-Commerce System is making a request to an outside service. IS confirms inventory levels, while PG processes the actual financial transaction.
4. The Workflow: From Code to Documentation
Once the script is written, VPasCode offers a powerful workflow for collaboration and publishing, transforming static diagrams into living documentation.
AI Diagnostics
If you introduce a syntax error in the text editor, the AI Diagnostics feature (visible as a button in the top bar) can instantly identify the issue and suggest a fix, ensuring the diagram renders correctly without manual debugging.
Collaboration & Sharing
Agile teams thrive on transparency. Instead of exporting a static image (PNG/JPG) and losing the ability to edit:
- You can generate a shareable web link.
- Share this link directly in Slack or Microsoft Teams channels.
- This ensures all stakeholders are viewing the most recent version of the system architecture, eliminating confusion caused by outdated screenshots.
Publishing to OpenDocs
The final step involves embedding these dynamic diagrams into OpenDocs. This transforms isolated files into a centralized, living documentation portal. When an engineer updates the PlantUML code in VPasCode, the documentation in OpenDocs automatically reflects those changes, keeping the knowledge base current and aligned with the actual system behavior.
Related posts:
 Mastering System Architecture: Refining Use Case Diagrams with VPasCode and Embedded AI
 Mastering System Architecture with VPasCode: A Guide to Just-in-Time Diagram-as-Code
 Mastering Diagram-as-Code: A Deep Dive into VPasCode’s Embedded AI Architecture
 Mastering Diagram-as-Code with VPasCode: Architecture, AI, and Workflow