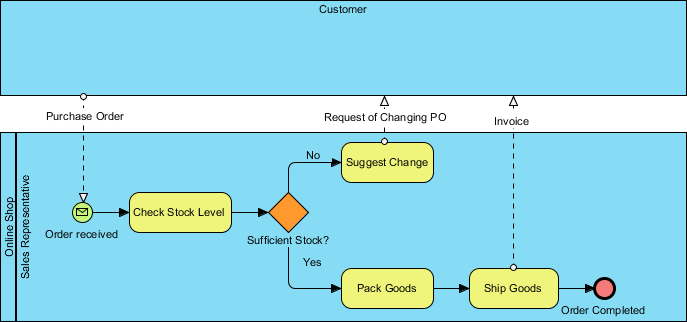
In the world of Business Process Management (BPM), clarity is king. When transforming a business from a manual, error-prone state to an automated future state, we need precise visual models to communicate the logic. The diagram provided is a classic example of a BPMN 2.0 (Business Process Model and Notation) diagram. It visualizes the “As-Is” process of an online shop representative handling customer orders.
This tutorial will deconstruct this diagram, explaining the architecture, the symbols used, and the logical flow from order receipt to shipment.
Understanding the Layout: Swimlanes and Boundaries
Before diving into the steps, we must understand the structure. The diagram utilizes a Swimlane pattern, which is essential for assigning responsibility.
- The Context Boundary: The large blue area represents the “System” or the “Online Shop” scope. Any process inside this boundary is part of the automated or managed system.
- The Swimlanes:
- Top Lane (Customer): Represents the external entity initiating the process.
- Bottom Lane (Online Shop / Sales Representative): This is where the action happens. It depicts the workflow performed by the sales team or the system acting on their behalf.
The Process Flow: From Start to Finish
Let’s walk through the process step-by-step, analyzing the BPMN symbols as we go.
1. Initiation: The Purchase Order
The process begins with an external trigger. The Customer submits a Purchase Order. Visually, this is represented by a dashed arrow originating from the top lane and pointing into the “Online Shop” lane.
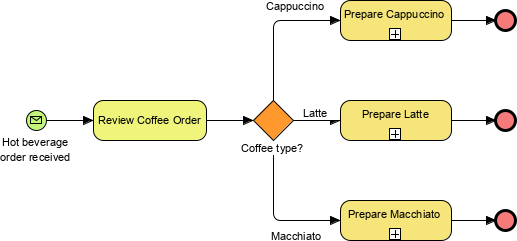
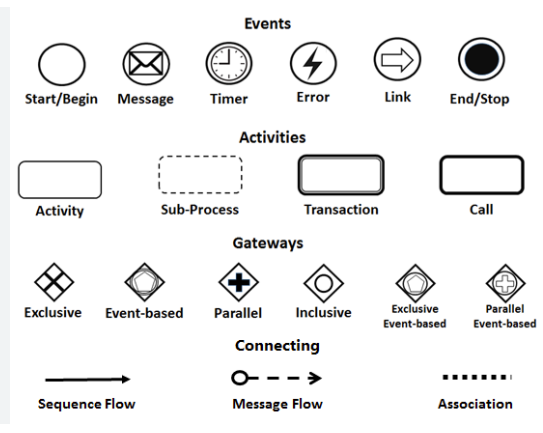
- Event (Envelope Icon): The green circle with an envelope represents a Message Start Event. It signifies that the process starts only when a specific message (the order) is received.
- Label: “Order received” confirms the successful entry of data into the system.
2. The Core Task: Checking Stock
Once the order is in, the system or representative must validate it. This is the first main activity.
- Task (Rounded Yellow Rectangle): The box labeled Check Stock Level is a standard Task. In a real-world scenario, this could be a manual spreadsheet check or an automated API call to a database.
3. The Decision Gate: Sufficient Stock?
This is the critical branching point of the logic. The diagram uses a diamond shape to represent a Gateway.
- Exclusive Gateway (Diamond): The diamond labeled “Sufficient Stock?” indicates a decision point. The process will take exactly one path based on the condition.
- The “No” Path: If the stock is insufficient, the flow moves to the top right. This path leads to a task labeled Suggest Change, after which a message is sent back to the customer (Request of Changing PO). This creates a feedback loop.
- The “Yes” Path: If stock is available, the flow moves downward, proceeding with fulfillment.
4. Fulfillment: Packing and Shipping
Assuming the “Yes” path is taken, the process moves to the final execution phase.
- Pack Goods: The system or staff prepares the items for dispatch.
- Ship Goods: The items are sent to the customer. This is the final major task.
- Outcome: Upon completion, a dashed arrow points upward to the “Customer” lane, labeled Invoice. This indicates that a notification or document is sent to the client to complete the transaction.
Termination: The End Event
The process concludes at the far right with a solid red circle labeled “Order Completed.”
- End Event: This symbol indicates the successful termination of the process instance. Once this node is reached, no further actions are required for this specific order.
Key Takeaways for Process Modeling
This diagram is a perfect example of how to model a standard business logic flow. It highlights:
- Traceability: Every input (Order) has a corresponding output (Invoice).
- Logic Branching: The Exclusive Gateway handles exceptions (low stock) gracefully.
- Clear Roles: Swimlanes clearly distinguish what the Customer does versus what the Sales Representative does.
By mastering these symbols, you can translate complex business requirements into clear, actionable technical diagrams.