


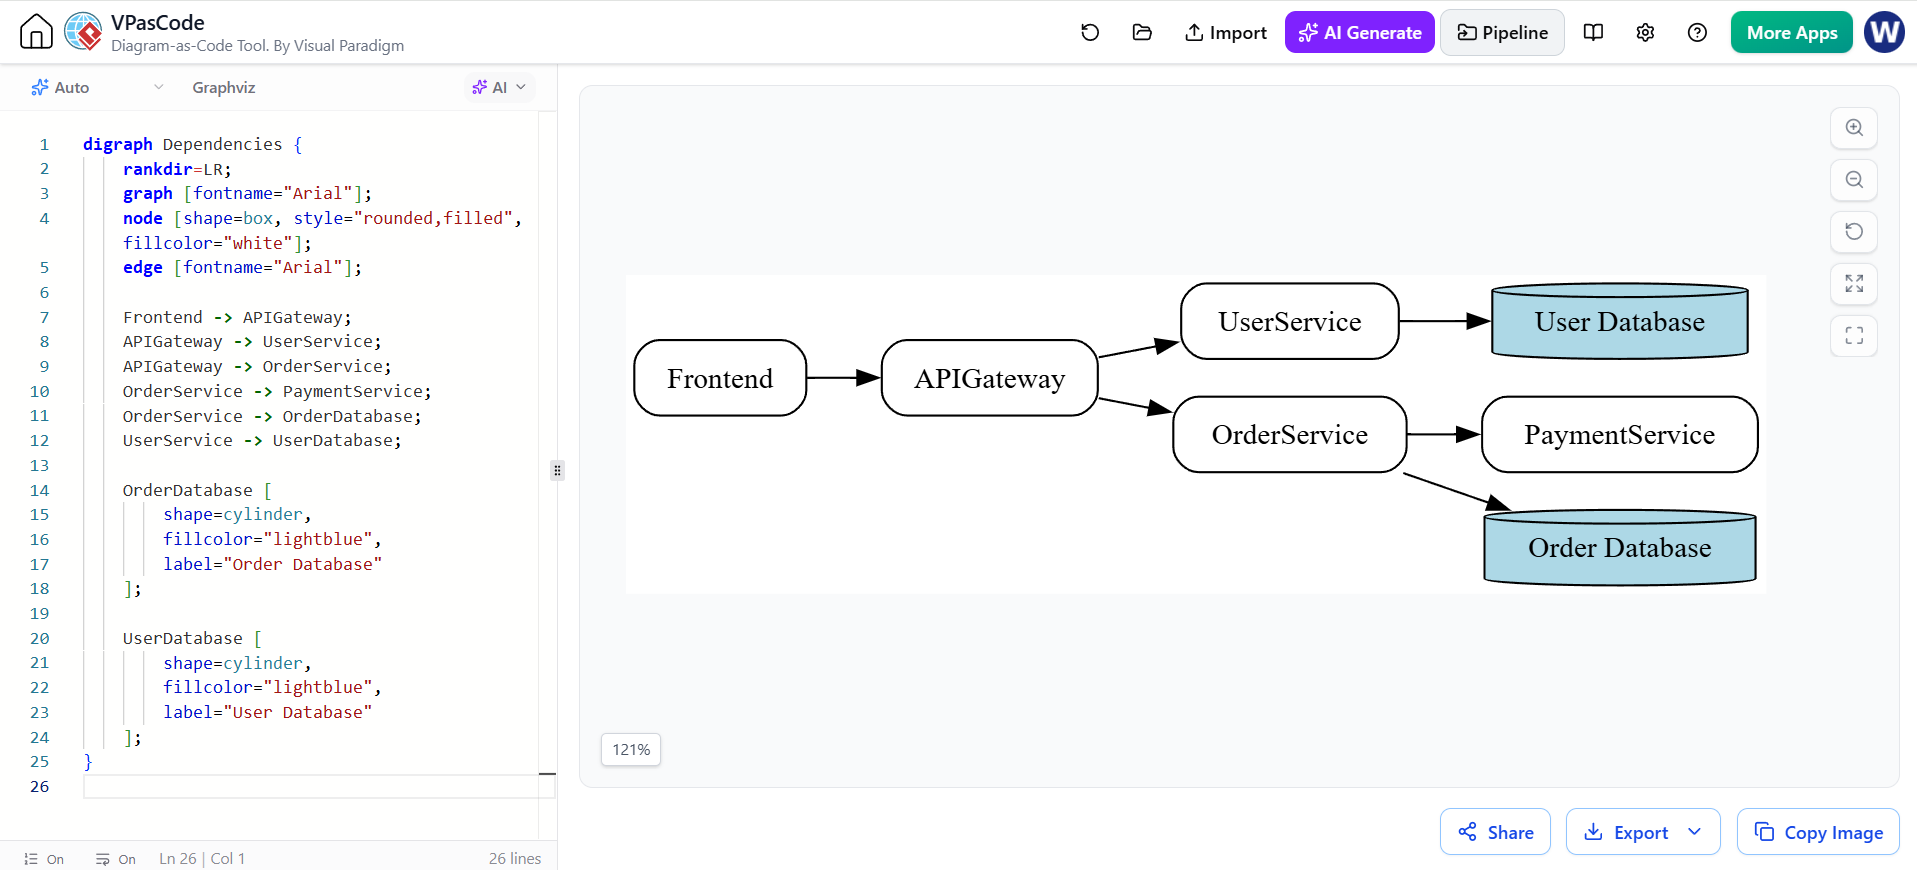
In modern software engineering, understanding the complex web of connections within an application is just as critical as writing the code itself. This is where Dependency Graphs become indispensable. They provide a high-level view of how different components—such as services, databases, and user interfaces—interact, allowing architects to identify bottlenecks and potential points of failure before they become critical issues.
This tutorial explores how to model these critical architectural relationships using Graphviz within the VPasCode environment by Visual Paradigm. We will move from the theoretical concepts of dependency mapping to a practical, “Diagram-as-Code” implementation.
Why Model Dependencies?
A dependency graph is a directed graph that represents the relationships between software components. In a microservices or modular architecture, these relationships dictate the flow of data and control. By visualizing these dependencies, you can:
- Identify Highly Depended-on Services: Spot the “central hubs” of your system that, if they fail, bring down the entire architecture.
- Spot Long Dependency Chains: Detect complex call chains that introduce latency and complexity.
- Manage Database Ownership: Clearly define which service is responsible for which data store to prevent shared database anti-patterns.
- Visualize Coupling: See how tightly coupled your services are and where you might need to decouple them for better scalability.
Step-by-Step: Building a Dependency Graph in VPasCode
VPasCode allows you to define these diagrams using text-based code, making it version-control friendly and easy to generate via CI/CD pipelines. Below is the breakdown of the provided example, which models a typical e-commerce architecture.
1. Defining the Graph Structure
We begin by declaring the graph type. In Graphviz, a digraph (directed graph) is used because dependencies have a specific direction (e.g., Service A calls Service B).
digraph Dependencies {
  rankdir=LR;
  graph [fontname="Arial"];
  node [shape=box, style="rounded,filled", fillcolor="white"];
  edge [fontname="Arial"];

  Frontend -> APIGateway;
  // ... more edges
}
Key Concepts:
digraph Dependencies { ... }: Sets the name of the graph to “Dependencies”.rankdir=LR;: This is a powerful styling command. It stands for “Left to Right”. It forces the graph layout engine to render the flow horizontally, which is often more natural for reading system flows than the default Top-to-Bottom.
2. Global Styling
To ensure consistency, we define global styles for the graph, nodes, and edges. This is done in the header of the script.
graph [fontname="Arial"];
node [shape=box, style="rounded,filled", fillcolor="white"];
edge [fontname="Arial"];
Analysis:
node [shape=box, style="rounded,filled", fillcolor="white"];: This applies a uniform look to every service node (like APIGateway or UserService). They will appear as rounded boxes with a white background.edge [fontname="Arial"];: Ensures that the arrows connecting the nodes use the same clean font as the labels.
3. Defining Relationships (Edges)
The core of the architecture lies in the edges. An arrow A -> B signifies that A depends on B.
Frontend -> APIGateway;
APIGateway -> UserService;
APIGateway -> OrderService;
OrderService -> PaymentService;
OrderService -> OrderDatabase;
UserService -> UserDatabase;
Architectural Insight:
Notice how the APIGateway acts as a central integration point. It receives traffic from the Frontend and routes it to specific services. The OrderService demonstrates a direct dependency on a database, a pattern often seen in domain-driven design.
4. Customizing Specific Nodes
While the global settings apply to all nodes, specific nodes can be overridden to represent different types of resources. In our example, the databases are distinguished by shape and color.
OrderDatabase [
    shape=cylinder,
    fillcolor="lightblue",
    label="Order Database"
];

UserDatabase [
    shape=cylinder,
    fillcolor="lightblue",
    label="User Database"
];
Why use shape=cylinder?
In standard data flow notation, a cylinder universally represents a database or storage unit. By overriding the default box shape for these specific nodes, we make the diagram instantly readable: boxes are logic/services, and cylinders are data.
Putting It All Together
By combining these elements, you create a robust, self-documenting diagram. The resulting visualization clearly separates the logical flow (Frontend to Gateway to Services) from the physical storage layer (Databases).
Conclusion
Using Graphviz in VPasCode transforms architecture documentation from a manual, error-prone drawing exercise into a precise, code-driven process. By defining your architecture as code, you ensure that your diagrams remain synchronized with your actual system structure, making it easier to spot architectural debt and communicate complex designs effectively.
Related posts:
 Mastering System Architecture with VPasCode: A Guide to Just-in-Time Diagram-as-Code
 Mastering Diagram-as-Code: A Deep Dive into VPasCode’s Embedded AI Architecture
 Mastering System Architecture: Refining Use Case Diagrams with VPasCode and Embedded AI
 Mastering Browser-Based Modeling: A Guide to VPasCode Architecture and Workflow