


Introduction
In today’s fast-paced digital landscape, clear visual communication is essential for documenting processes, algorithms, and decision paths. Traditional flowchart creation often involves tedious manual dragging of shapes, aligning connectors, and ensuring consistent notation—a time-consuming process that can distract from the core task of logical thinking and process design.
Visual Paradigm has revolutionized this workflow by integrating artificial intelligence directly into its modeling and documentation ecosystem. Through Visual Paradigm Desktop, VP Online, and OpenDocs, users can now generate, refine, and manage flowcharts using natural language prompts, significantly accelerating the diagramming process while maintaining professional quality and flexibility.
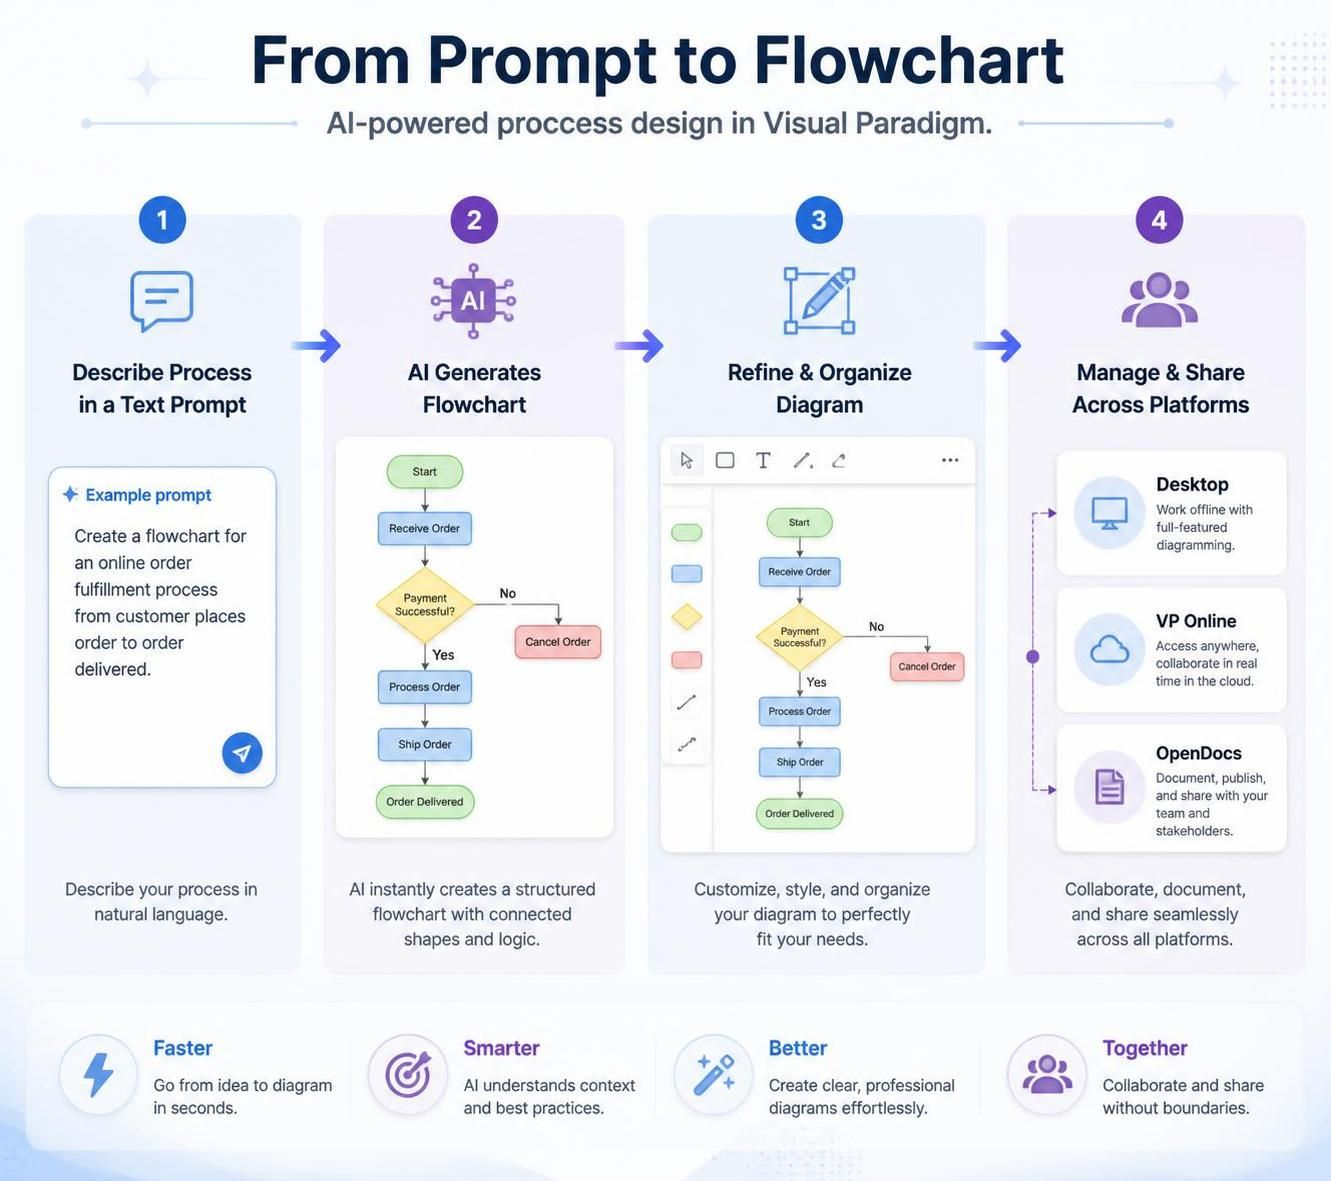
This comprehensive guide explores how Visual Paradigm’s AI-powered features transform flowchart creation from a manual chore into an intelligent, conversational experience. Whether you’re a product manager documenting user workflows, a developer mapping out algorithm logic, or a business analyst clarifying decision trees, this guide will help you leverage Visual Paradigm’s full potential.
Key Concepts
1. Text-to-Flowchart Generation
Concept: Convert plain text descriptions into structured, visually balanced flowcharts instantly.
How It Works:
-
Input a natural language description of your process (e.g., “User login flow with password validation and account lockout after three failed attempts”)
-
The AI interprets the text and automatically generates:
-
Start and end nodes
-
Process boxes for actions
-
Decision diamonds for conditional branches
-
Connectors with proper routing
-
Standard flowchart notation compliance
-
Example Prompt:
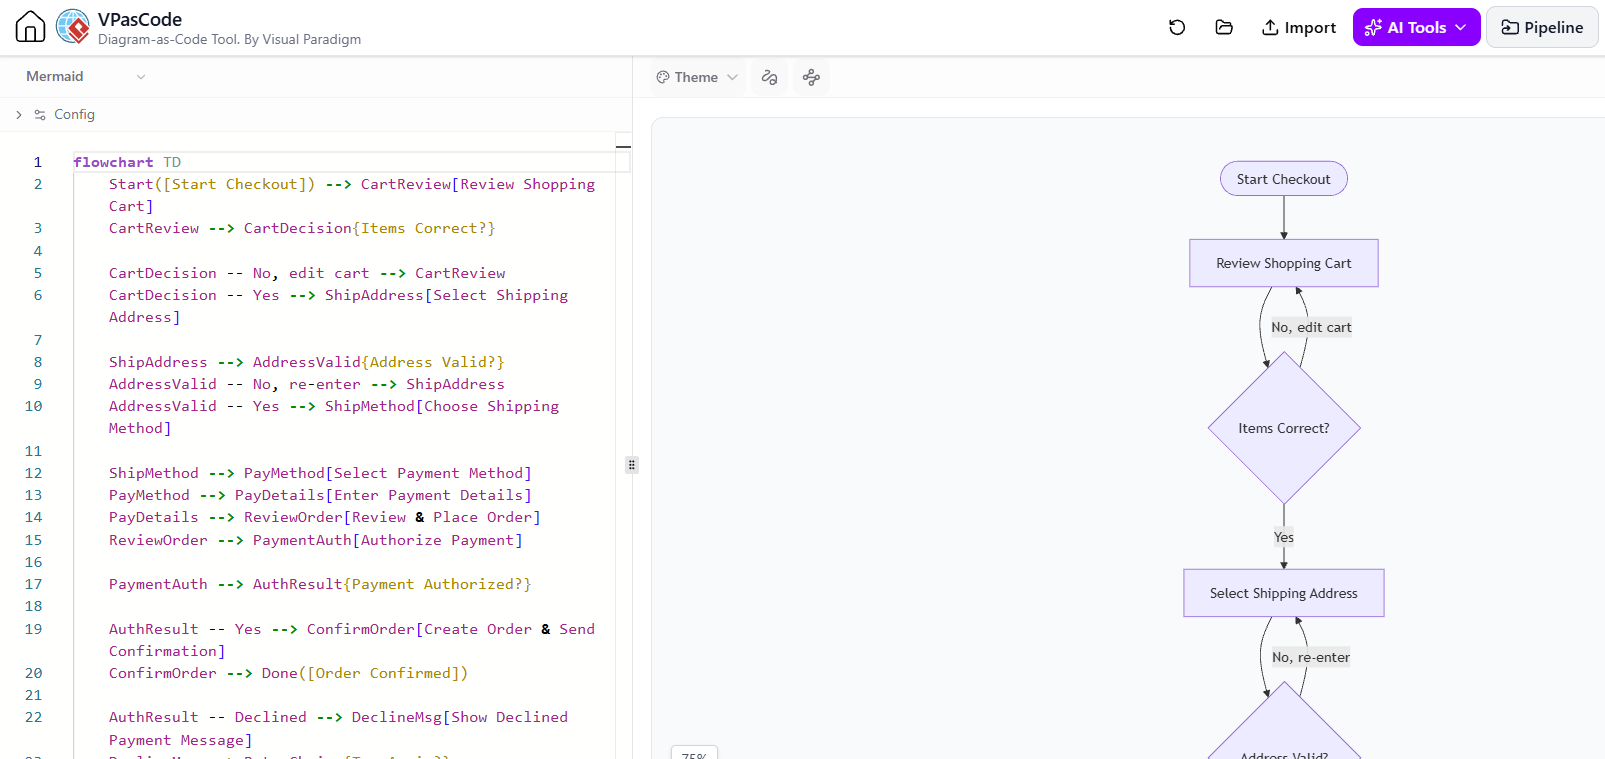
“Create a flowchart for an e-commerce checkout process that includes cart review, shipping address selection, payment method choice, order confirmation, and error handling for declined payments.”
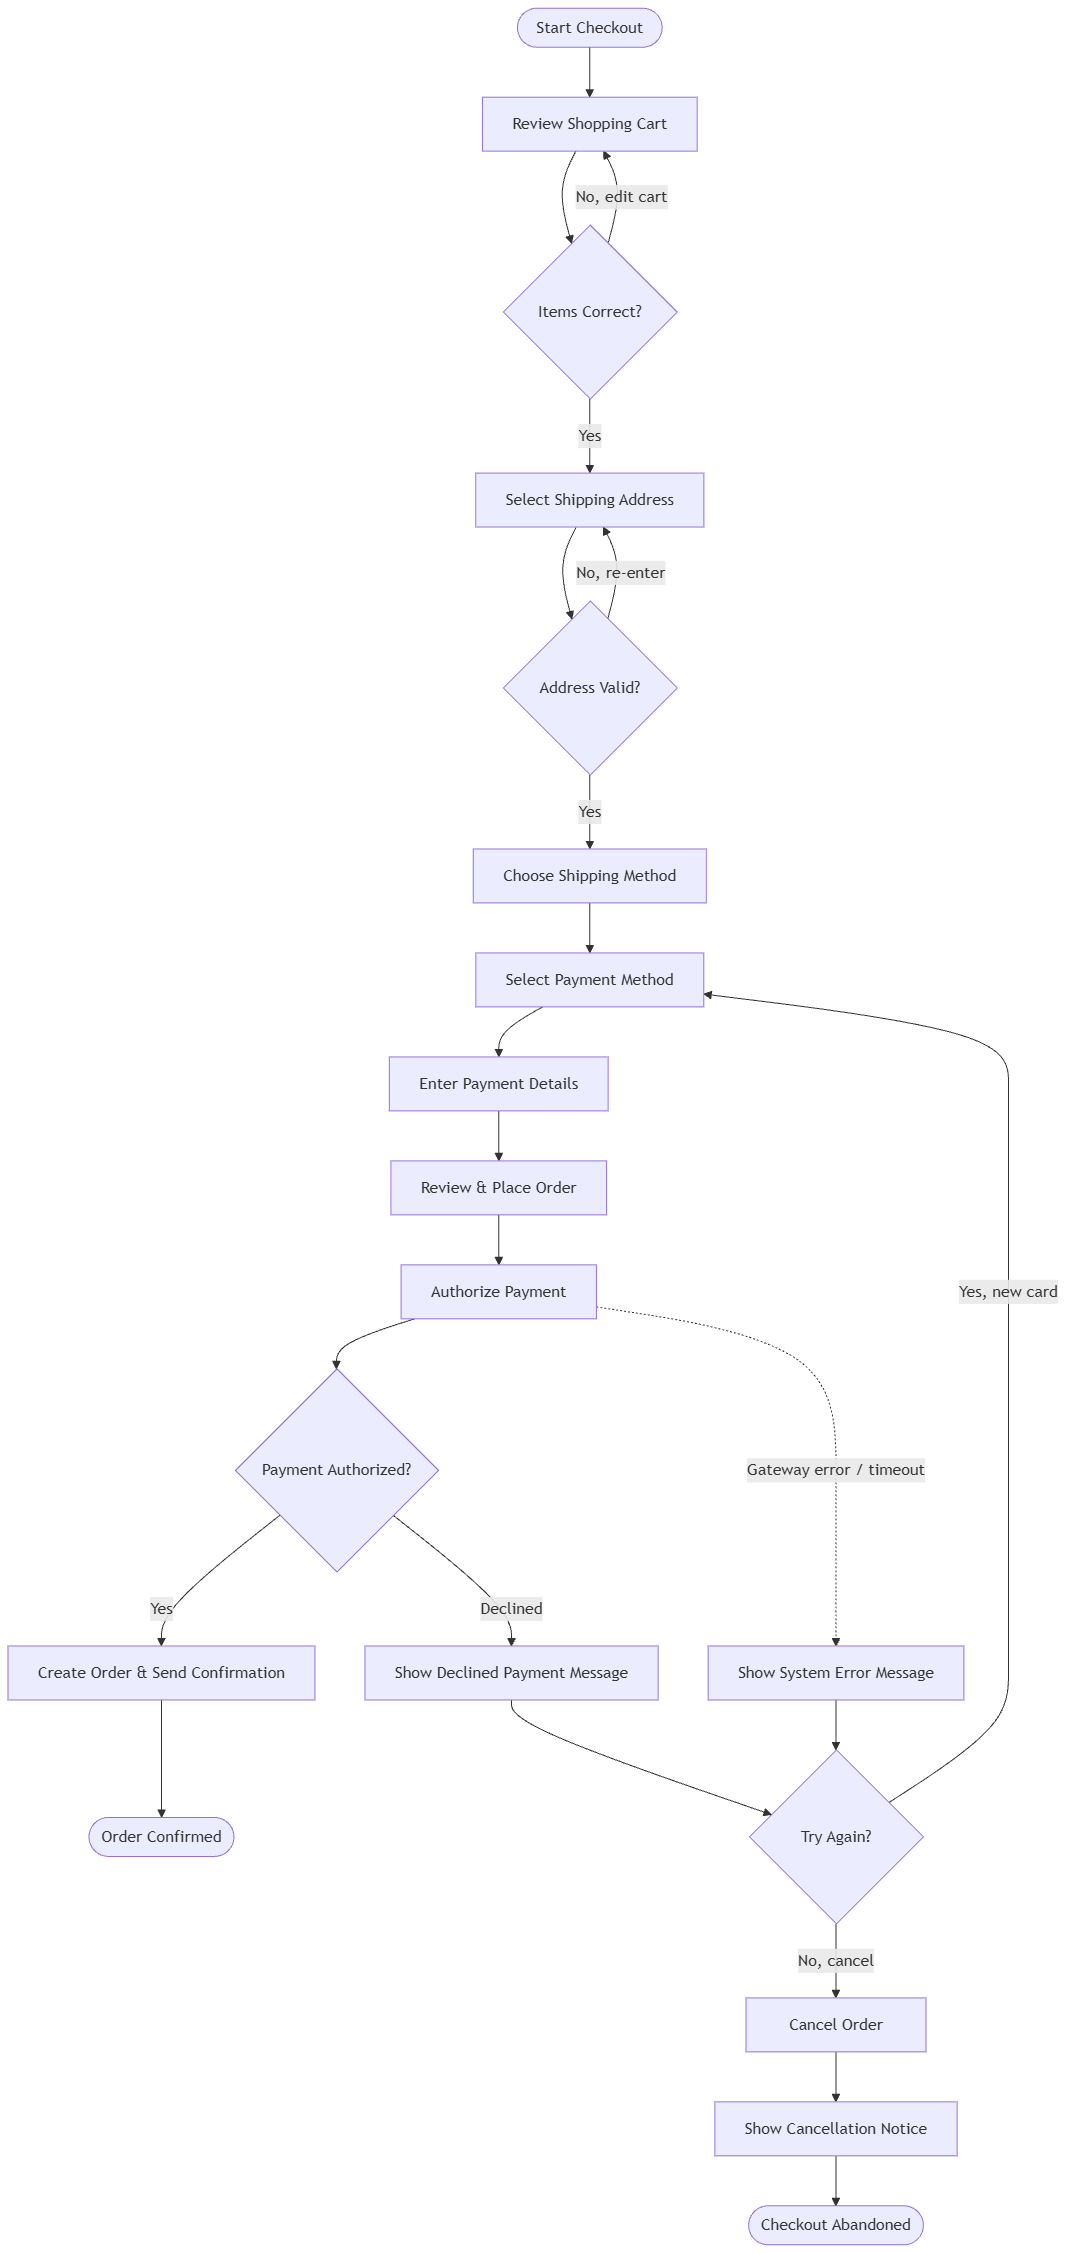
Result: A complete, professionally laid-out flowchart with all necessary components, ready for immediate use or further refinement.
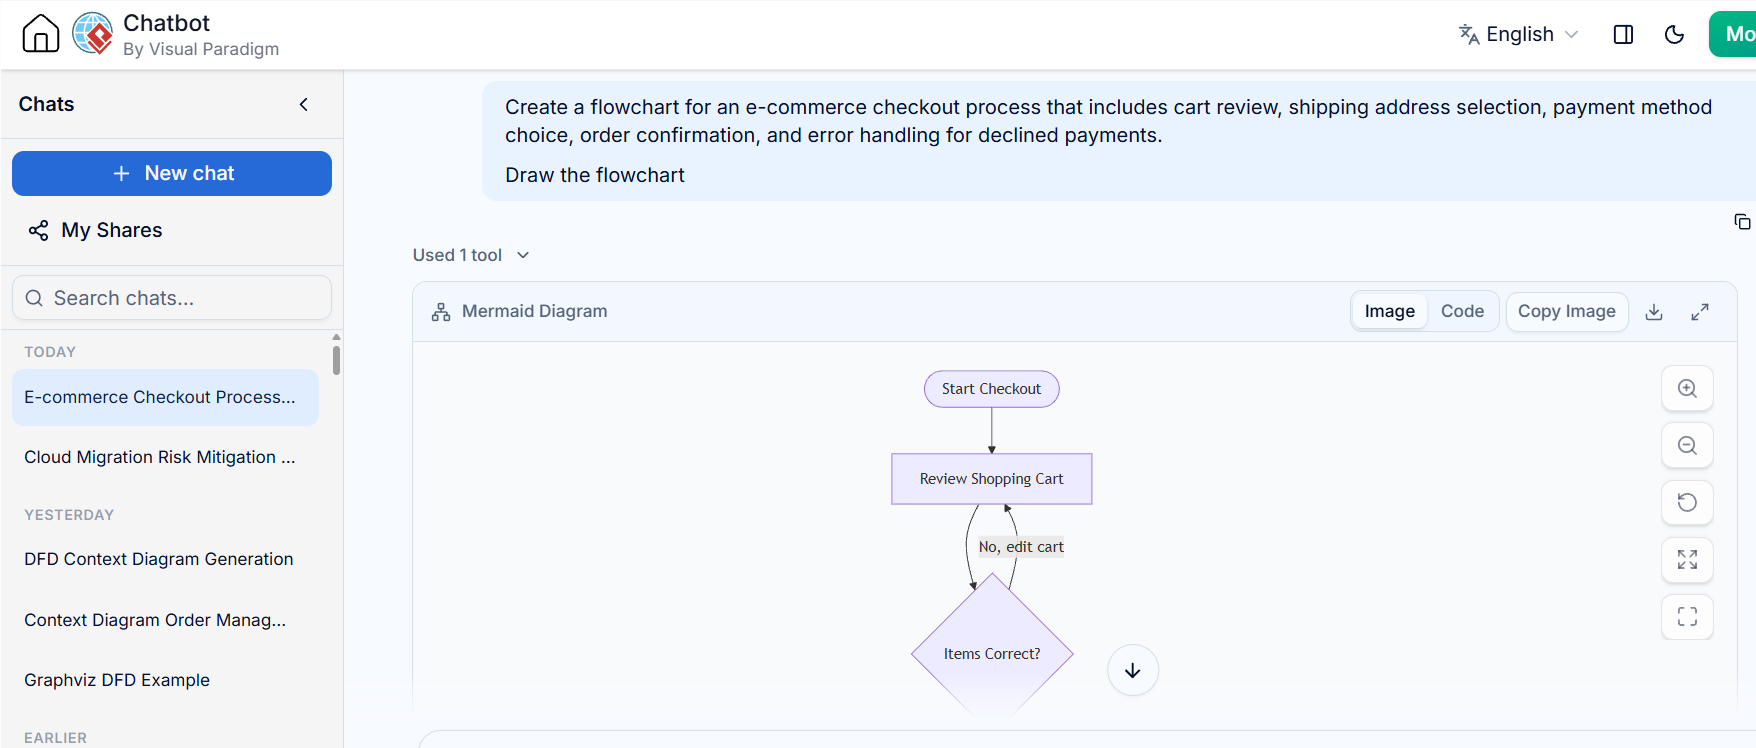
Do it in Chatbot: (Generate Mermiad Code)
View and verify the Flowchart in VPasCode:
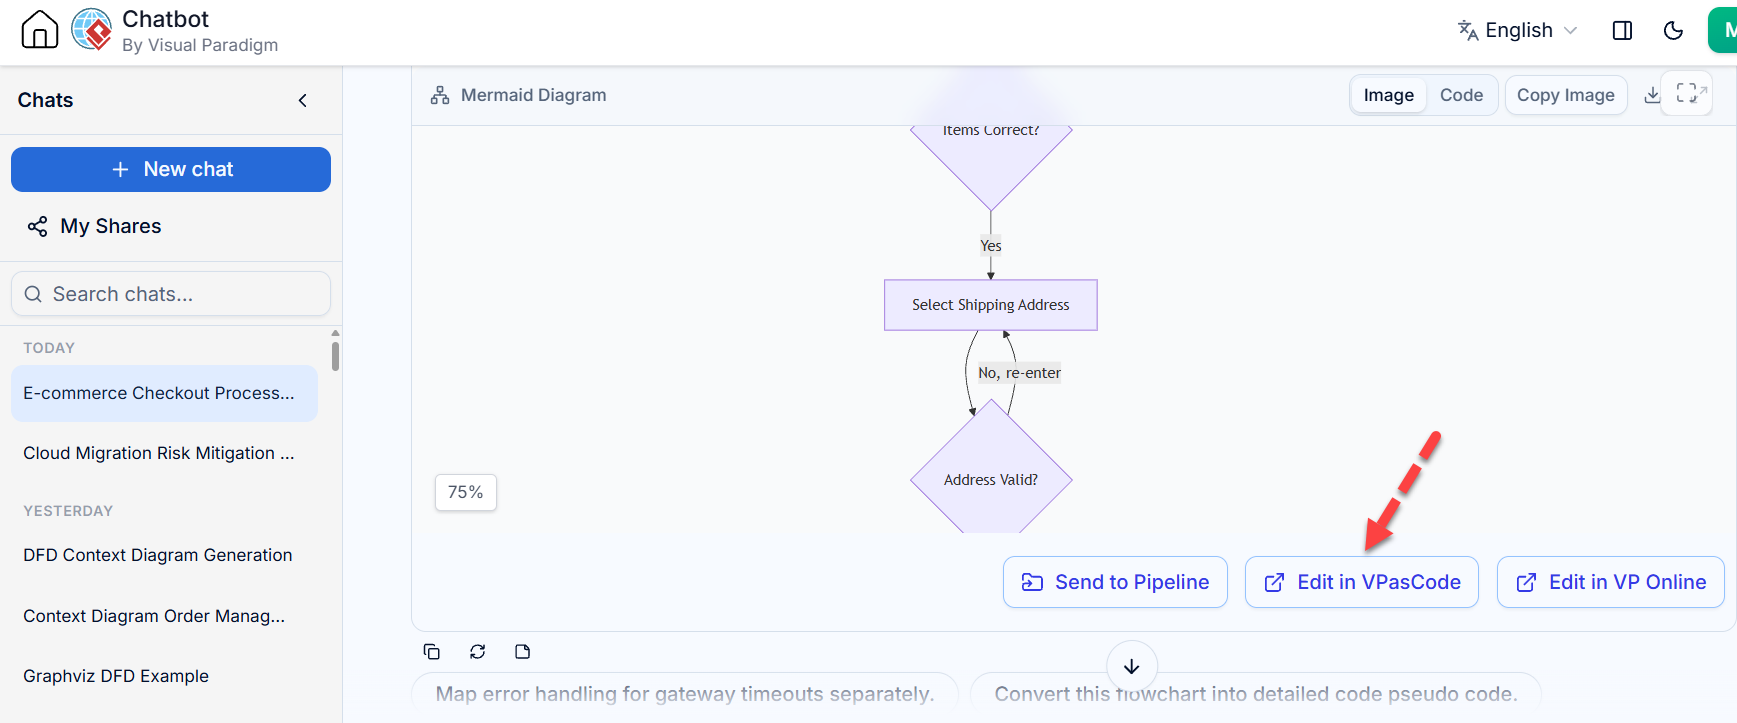
Send To VPasCode:
2. Standard Symbols & Clean Layout Automation
Concept: Eliminate manual formatting by leveraging AI-driven auto-alignment and spacing.
Benefits:
-
Balanced Spacing: Nodes are evenly distributed for optimal readability
-
Auto-Alignment: Shapes align perfectly without manual adjustment
-
Standard Notation: Ensures compliance with industry-standard flowchart symbols (ISO/ANSI)
-
Consistent Styling: Uniform colors, fonts, and line weights across the diagram
Why It Matters:
Professional presentation enhances stakeholder understanding and reduces ambiguity. Automated layout ensures your diagrams look polished from the start, saving hours of manual tweaking.
3. Flexible Embedding & Component Pages
Concept: Integrate flowcharts seamlessly into documentation and make them reusable across projects.
Two Primary Approaches:
A. Embed Dynamic Flowcharts
-
Insert interactive flowchart components directly into documentation pages within OpenDocs
-
Flowcharts remain live and editable within the document context
-
Ideal for process documentation, technical specifications, and user guides
B. Standalone Component Pages
-
Create dedicated flowchart component pages in VP Online OpenDocs
-
Link or embed these components across multiple workspace documents
-
Enables single-source-of-truth management: update once, reflect everywhere
Use Case Example:
A product team creates a master “User Onboarding Flow” component page. This flowchart is then embedded in:
-
Product requirement documents
-
Engineering technical specs
-
Customer-facing help articles
-
Internal training materials
When the onboarding process changes, updating the master component automatically updates all linked instances.
4. Full Manual & Visual Editing Control
Concept: AI generation is the starting point, not the endpoint—you retain complete creative control.
Customization Options:
-
Shape Modification: Change node types, sizes, and styles
-
Color Schemes: Apply brand colors or thematic palettes
-
Label Editing: Refine text for clarity or specificity
-
Line Routing: Adjust connector paths for optimal visual flow
-
Node Sequencing: Reorder steps or add/remove elements
Workflow:
-
Generate initial flowchart via AI prompt
-
Review and identify areas for improvement
-
Manually edit using Visual Paradigm’s intuitive drag-and-drop interface
-
Iterate until the diagram perfectly represents your process
5. AI Diagramming Chatbot / Assistant
Concept: Use conversational AI to iteratively refine and expand your flowcharts.
Capabilities:
-
Refactoring: “Simplify this flowchart by combining redundant steps”
-
Expansion: “Add a password recovery flow to the login process”
-
Logic Enhancement: “Include a review step before final approval”
-
Branch Addition: “What happens if the payment gateway times out? Add that scenario”
Interactive Example:
User: “Here’s my current user registration flow. Can you add email verification and handle cases where the verification link expires?”
AI Assistant: Generates updated flowchart with:
Email sending step after registration
Verification link click action
Expiration check with timeout logic
Resend verification option
Error states for invalid/expired links
This conversational approach makes complex diagram evolution intuitive and efficient.
6. Context-Aware Expansion & Analysis
Concept: The AI understands your diagram’s context and proactively suggests improvements.
Features:
-
Missing Step Detection: Identifies gaps in logic or incomplete branches
-
Related Component Suggestions: Recommends additional elements based on industry best practices
-
Plain-English Q&A: Ask questions about your diagram (e.g., “What are all the possible exit points from this process?”)
-
Automatic Documentation: Generates textual summaries and explanations of your flowchart
-
Logic Validation: Flags potential infinite loops, unreachable nodes, or ambiguous decisions
Example Query:
“Analyze this order fulfillment flowchart and identify any potential bottlenecks or missing error handling.”
AI Response: Provides a detailed analysis highlighting:
-
Missing inventory check before payment processing
-
No retry mechanism for failed warehouse notifications
-
Potential deadlock if both payment and shipping fail simultaneously
7. Cross-Platform Sync & Export Flexibility
Concept: Seamlessly move between desktop and cloud environments, and export to multiple formats for diverse use cases.
Synchronization:
-
Visual Paradigm Desktop Sync: Keep local and cloud models in perfect alignment
-
Real-Time Collaboration: Multiple team members can work on the same diagram
-
Version History: Track changes and revert if needed
Export Formats:
-
Image Formats: PNG, SVG (for presentations and web embedding)
-
Documentation Formats: Markdown (for GitHub wikis, technical docs)
-
Code-Compatible Formats:
-
PlantUML (for version-controlled diagram-as-code)
-
Mermaid (for Markdown-rendered diagrams in Git platforms)
-
Graphviz DOT files (for programmatic manipulation)
-
-
VPasCode Integration: Pass scripts for code-level tweaks and automation
Use Case:
A development team maintains their architecture diagrams in Git using PlantUML format. They create the initial diagram in Visual Paradigm using AI, then export to PlantUML for version control. When updates are needed, they modify the PlantUML code directly or regenerate via Visual Paradigm and re-export.
Practical Examples
Example 1: User Registration Flow
Prompt:
“Generate a flowchart for user registration including: email input, password creation with strength validation, email verification link, account activation, and error handling for duplicate emails or weak passwords.”
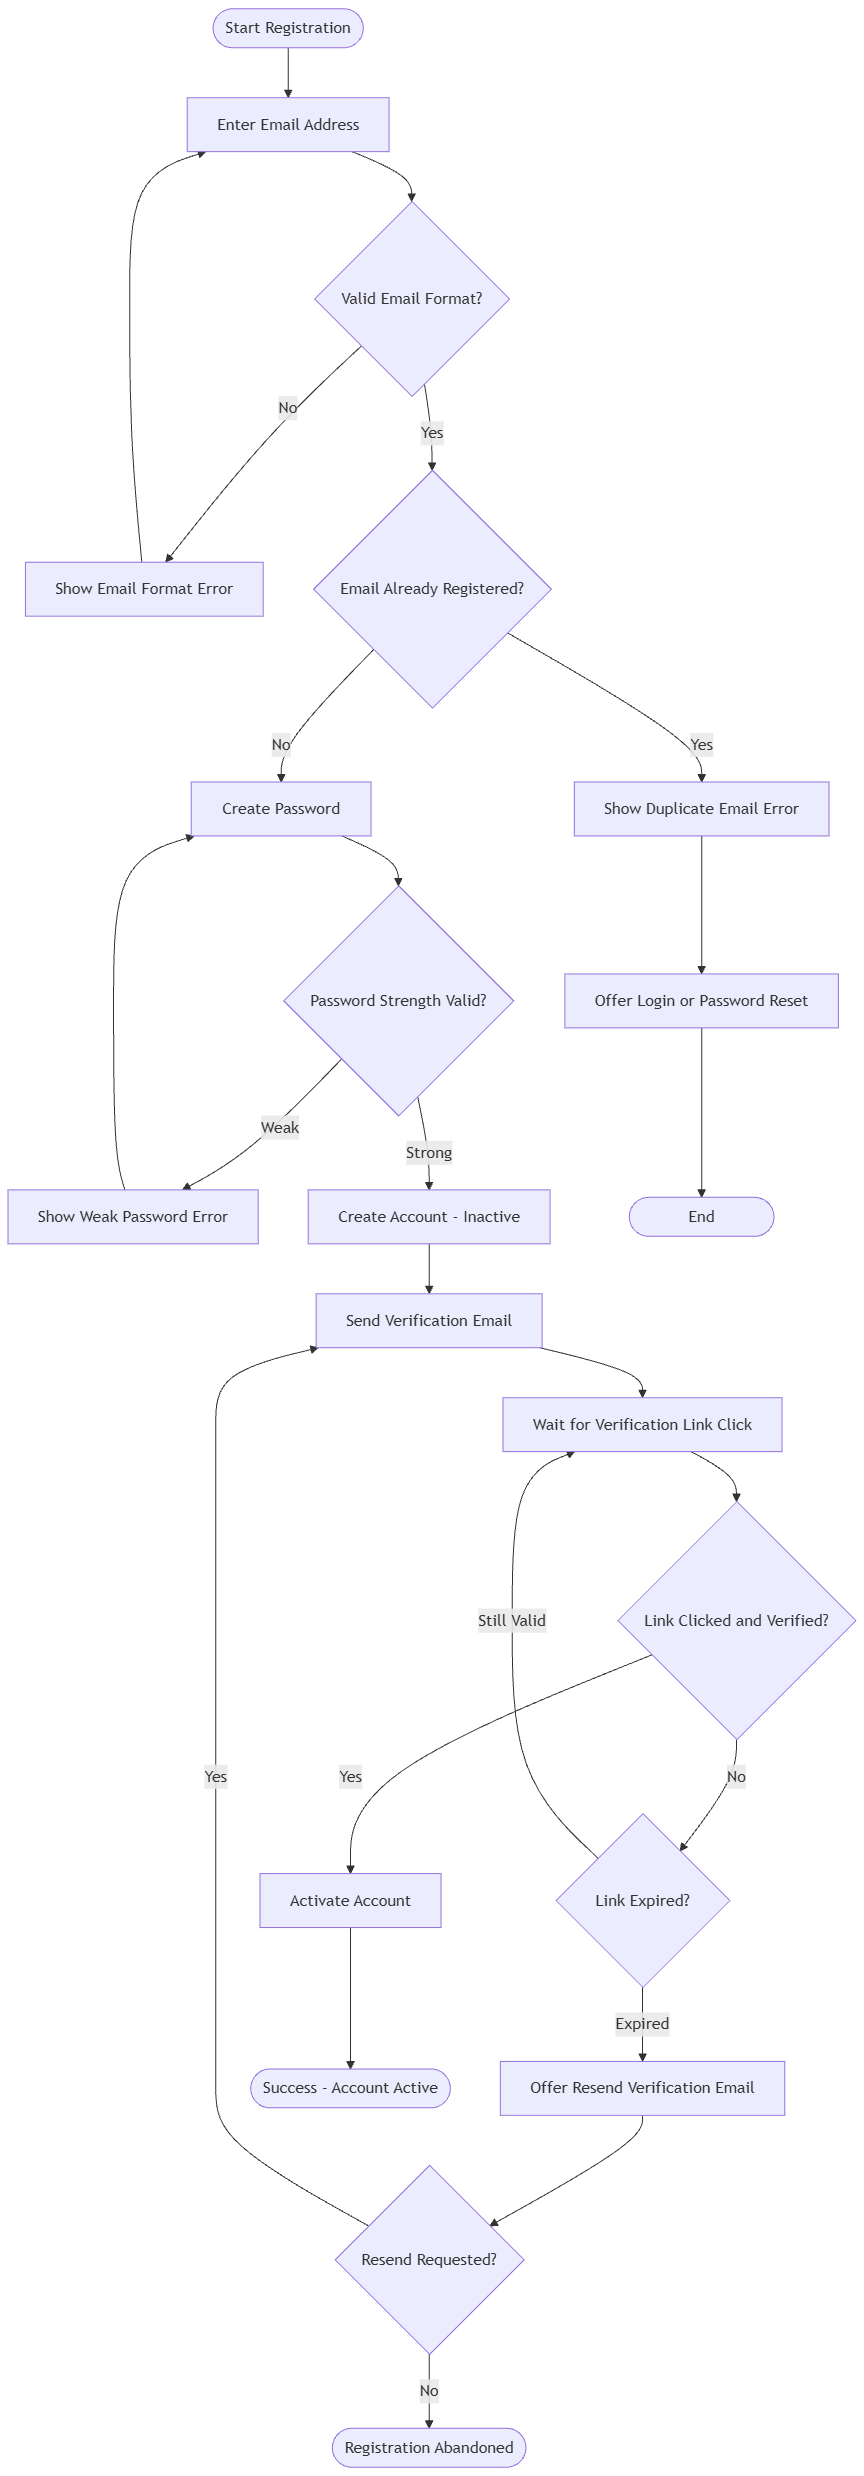
Generate Mermaid Diagram as Code:
flowchart TD
    Start([Start Registration]) --> EmailInput[Enter Email Address]
    EmailInput --> ValidateEmail{Valid Email Format?}
    ValidateEmail -- No --> EmailError[Show Email Format Error] --> EmailInput
    ValidateEmail -- Yes --> DupCheck{Email Already Registered?}
    DupCheck -- Yes --> DupError[Show Duplicate Email Error] --> LoginLink[Offer Login or Password Reset]
    DupCheck -- No --> PasswordCreate[Create Password]
    PasswordCreate --> StrengthCheck{Password Strength Valid?}
    StrengthCheck -- Weak --> WeakError[Show Weak Password Error] --> PasswordCreate
    StrengthCheck -- Strong --> CreateAccount[Create Account - Inactive]
    CreateAccount --> SendEmail[Send Verification Email]
    SendEmail --> WaitVerify[Wait for Verification Link Click]
    WaitVerify --> VerifiedCheck{Link Clicked and Verified?}
    VerifiedCheck -- No --> TimeoutCheck{Link Expired?}
    TimeoutCheck -- Still Valid --> WaitVerify
    TimeoutCheck -- Expired --> ResendOffer[Offer Resend Verification Email]
    ResendOffer --> ResendCheck{Resend Requested?}
    ResendCheck -- Yes --> SendEmail
    ResendCheck -- No --> Abandoned([Registration Abandoned])
    VerifiedCheck -- Yes --> Activate[Activate Account]
    Activate --> Success([Success - Account Active])
    LoginLink --> End([End])
AI Output:
-
Start → Email Input → Password Creation → Strength Check (Decision)
-
Weak → Show Error → Retry Password
-
Strong → Create Account → Send Verification Email
-
-
Wait for Verification Click (Decision)
-
Verified → Activate Account → Success End
-
Not Verified → Timeout Check (Decision)
-
Expired → Offer Resend → Loop Back
-
Still Valid → Continue Waiting
-
-
Manual Refinement:
-
Add “Forgot Password” branch from the login screen
-
Include CAPTCHA verification for bot prevention
-
Apply company brand colors
Example 2: Incident Response Workflow
Prompt:
“Create an IT incident response flowchart covering: incident detection, severity classification, team assignment, investigation, resolution, and post-incident review.”
AI Output:
Ask the AI generate the Flowchart using PlantUML Code:

Complete flowchart with:
-
Detection sources (monitoring alerts, user reports)
-
Severity matrix (P1-P4 classification)
-
Escalation paths based on severity
-
Investigation branching (network, application, database)
-
Resolution confirmation steps
-
Post-incident retrospective scheduling
Chatbot Enhancement:
“Add a communication plan for stakeholder updates at each severity level.”
AI inserts notification steps for P1/P2 incidents to executive leadership and customer success teams.
Example 3: E-Commerce Order Processing
Prompt:
“Map out the complete order processing flow from cart checkout to delivery confirmation, including payment processing, inventory checks, shipping label generation, and return handling.”
AI Output:
Comprehensive multi-path flowchart covering:
-
Cart validation
-
Payment gateway integration
-
Inventory reservation
-
Fraud detection checks
-
Warehouse picking/packing
-
Carrier selection and label printing
-
Tracking number generation
-
Delivery confirmation
-
Return initiation and processing
Export & Integration:
-
Export to SVG for customer-facing FAQ page
-
Export to PlantUML for engineering documentation repository
-
Embed dynamic version in internal operations wiki
Best Practices
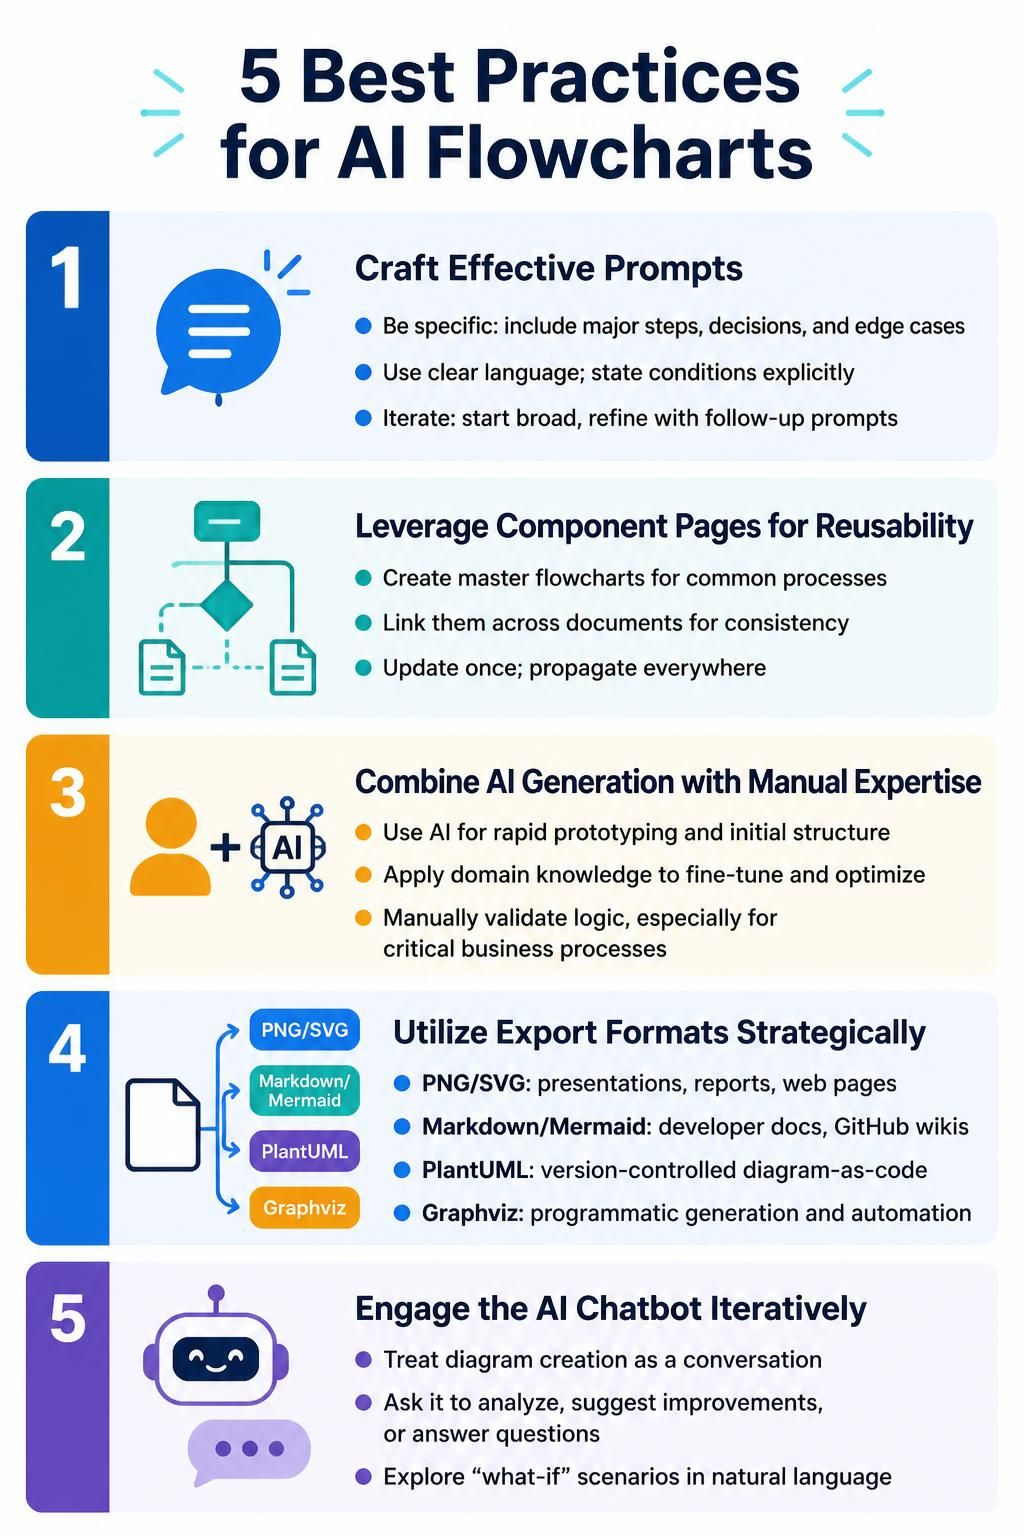
1. Craft Effective Prompts
-
Be Specific: Include all major steps, decision points, and edge cases
-
Use Clear Language: Avoid ambiguous terms; specify conditions explicitly
-
Iterate: Start broad, then refine with follow-up prompts
2. Leverage Component Pages for Reusability
-
Create master flowcharts for common processes
-
Link them across multiple documents to maintain consistency
-
Update once, propagate everywhere
3. Combine AI Generation with Manual Expertise
-
Use AI for rapid prototyping and initial structure
-
Apply domain knowledge for fine-tuning and optimization
-
Validate logic manually, especially for critical business processes
4. Utilize Export Formats Strategically
-
PNG/SVG: Presentations, reports, web pages
-
Markdown/Mermaid: Developer documentation, GitHub wikis
-
PlantUML: Version-controlled diagram-as-code workflows
-
Graphviz: Programmatic diagram generation and automation
5. Engage the AI Chatbot Iteratively
-
Treat diagram creation as a conversation
-
Ask the AI to analyze, suggest improvements, or answer questions
-
Use natural language to explore “what-if” scenarios
Conclusion
Visual Paradigm’s AI-powered flowchart ecosystem represents a significant leap forward in process documentation and visual communication. By combining instant text-to-diagram generation, intelligent layout automation, conversational refinement, and flexible export options, Visual Paradigm enables professionals to create high-quality flowcharts faster than ever before.
The key advantage lies in the balance between automation and control: AI handles the heavy lifting of structure and formatting, while users retain full authority over content, logic, and visual customization. Whether you’re working solo or collaborating with teams, the integration across Desktop, VP Online, and OpenDocs ensures seamless workflow continuity.
As organizations increasingly rely on clear process documentation for compliance, training, and operational efficiency, tools like Visual Paradigm’s AI diagramming suite become indispensable. By mastering these features, you can transform flowchart creation from a bottleneck into a strategic advantage—communicating complex processes with clarity, speed, and professionalism.
Start with a simple prompt, iterate with the AI assistant, refine manually, and export to your preferred format. The future of diagramming is conversational, intelligent, and effortlessly integrated into your existing workflow. Visual Paradigm makes that future available today.