


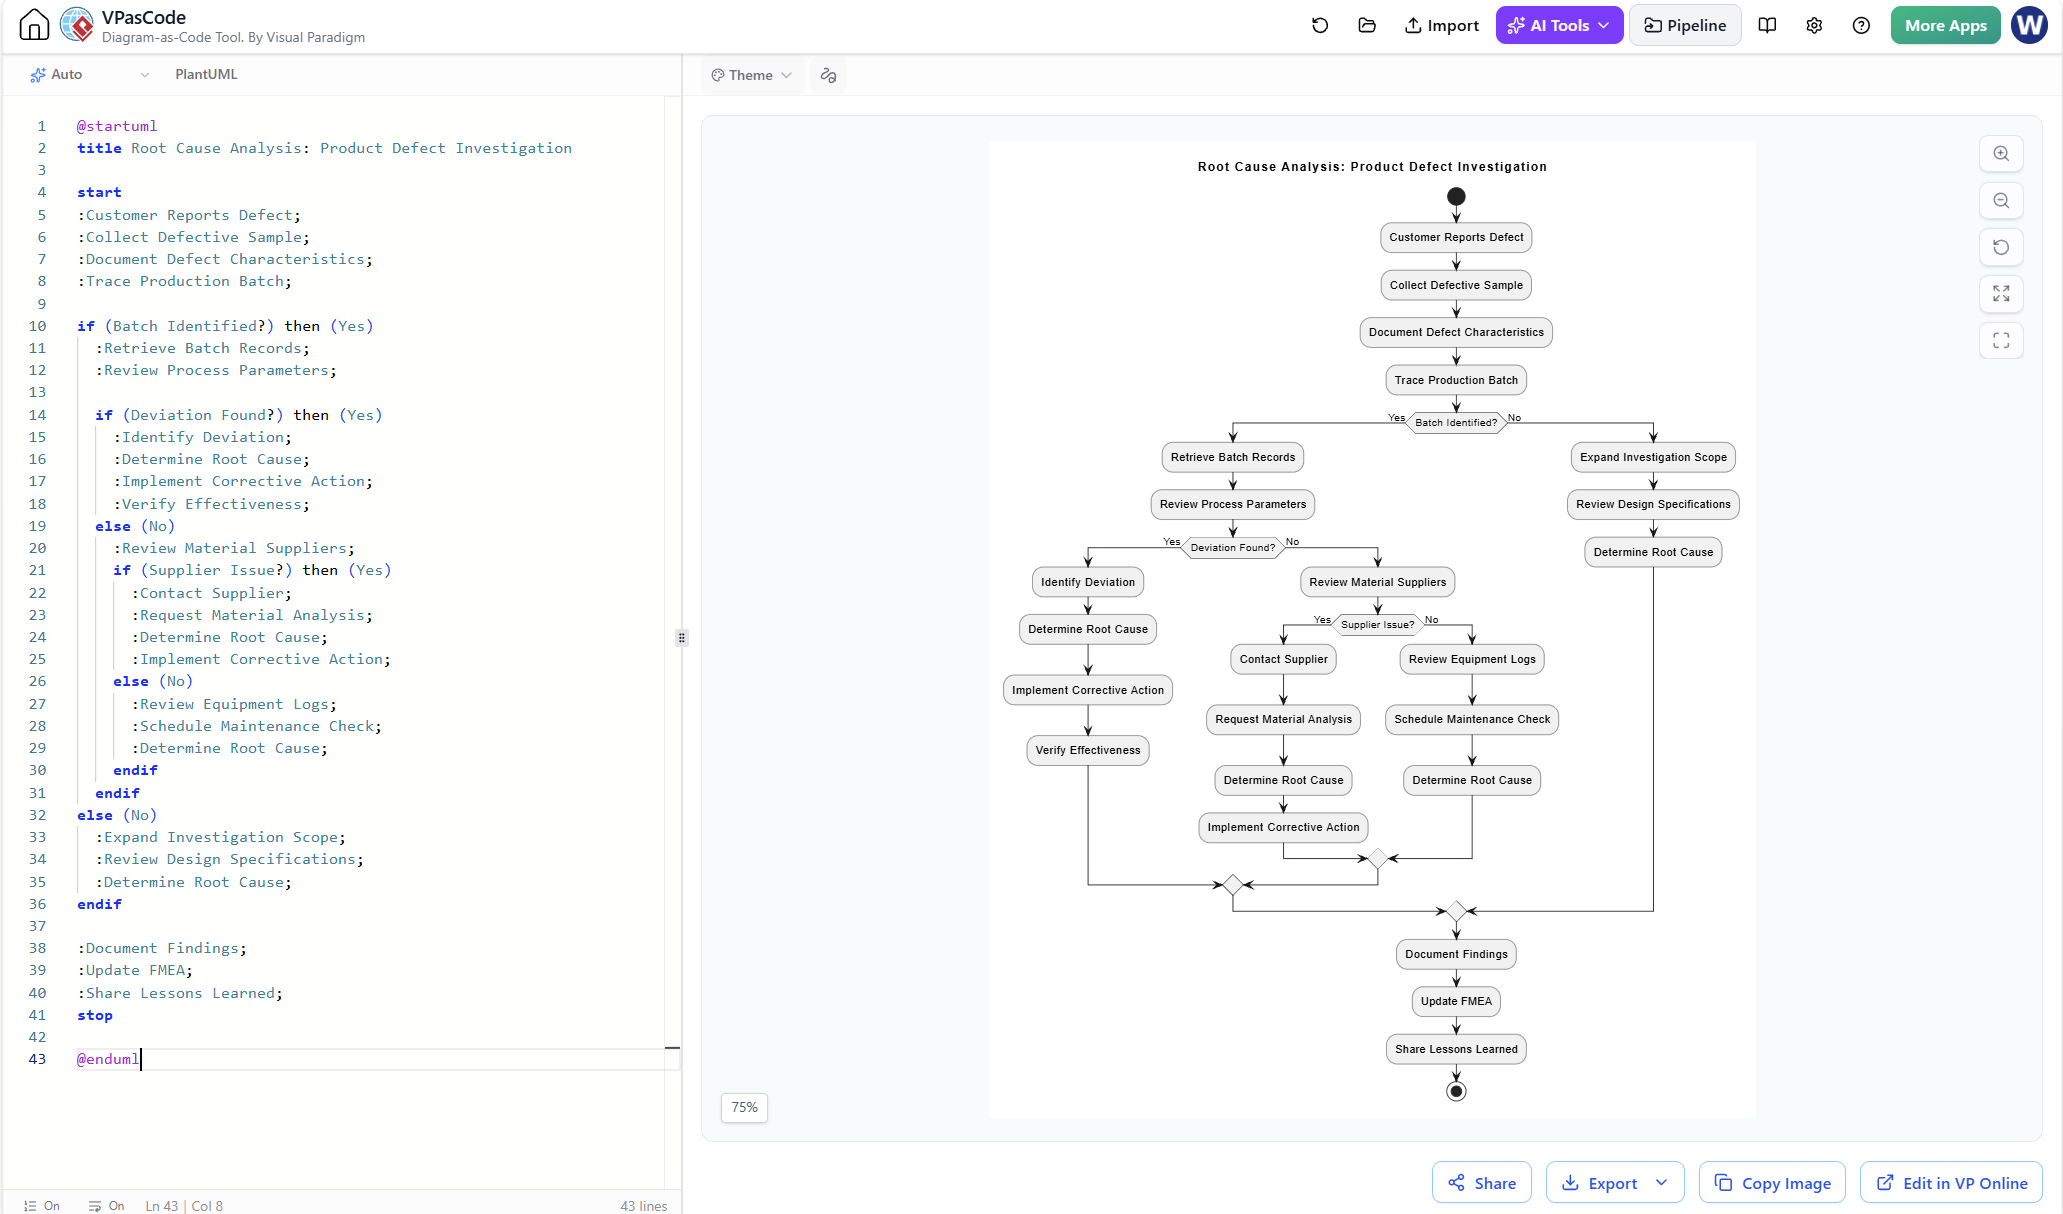
Root Cause Analysis (RCA) is a fundamental discipline in quality management and software engineering, used to identify the underlying causes of faults or problems rather than just treating symptoms. While traditional flowcharts can represent this logic, creating them manually is often tedious and prone to formatting errors. This tutorial demonstrates how to leverage VPasCode, Visual Paradigm’s diagram-as-code tool, to generate a sophisticated RCA flowchart using PlantUML syntax. By defining logic through text, you ensure that complex decision trees remain clean, version-controllable, and instantly visualizable.
Understanding the System Architecture
The diagram presented in the workflow represents a structured investigation process for a Product Defect Investigation. Unlike a simple linear process, this system architecture relies heavily on nested conditional logic. The flowchart guides the investigator through a series of binary decisions—such as “Batch Identified?” or “Deviation Found?”—to funnel the analysis toward a single root cause.
In the context of VPasCode, this architecture is defined by a top-down code structure:
- Entry Point: Defined by
start, initiating the sequence. - Process Nodes: Represented by the
:prefix, denoting actions like “Collect Defective Sample” or “Retrieve Batch Records”. - Decision Nodes: The
ifandelseblocks act as decision diamonds, splitting the flow based on boolean outcomes (Yes/No). - Exit Point: The
stopkeyword marks the conclusion of the investigation.
Step-by-Step Modeling Guide
To recreate this Root Cause Analysis diagram, you must understand how to translate the physical investigation steps into VPasCode syntax. The following sections break down the code structure line by line.
1. Initialization and Setup
The diagram begins with the standard PlantUML boilerplate. This establishes the tool (PlantUML) and sets the title for the generated visual.
@startuml
title Root Cause Analysis: Product Defect Investigation
start
The start keyword automatically renders a black filled circle, representing the “Initial Node” in UML Activity Diagram standards.
2. Sequential Processing
Before any decisions are made, the system must gather initial data. In VPasCode, these sequential steps are listed simply, one per line.
:Customer Reports Defect;
:Collect Defective Sample;
:Document Defect Characteristics;
:Trace Production Batch;
Notice the semicolon ; at the end of each line. In PlantUML, the semicolon is a required delimiter that tells the parser the current instruction is complete. Without it, the tool may throw a syntax error or render the nodes incorrectly.
3. Implementing Decision Logic (The If-Then Structure)
The core of this diagram is the branching logic. We start by checking if the production batch can be traced.
if (Batch Identified?) then (Yes)
  :Retrieve Batch Records;
  :Review Process Parameters;
  if (Deviation Found?) then (Yes)
    :Identify Deviation;
    :Determine Root Cause;
    :Implement Corrective Action;
    :Verify Effectiveness;
  else (No)
    :Review Material Suppliers;
    if (Supplier Issue?) then (Yes)
      :Contact Supplier;
      :Request Material Analysis;
      :Determine Root Cause;
      :Implement Corrective Action;
    else (No)
      :Review Equipment Logs;
      :Schedule Maintenance Check;
      :Determine Root Cause;
    endif
  endif
else (No)
  :Expand Investigation Scope;
  :Review Design Specifications;
  :Determine Root Cause;
endif
This section illustrates nesting. The second if statement is indented inside the first one, representing a sub-process. The syntax if (Question?) then (Yes) explicitly labels the decision diamond and the “True” path. The else (No) block handles the “False” path.
4. Finalization and Termination
Once the investigation reaches a conclusion (regardless of which branch it took), the process converges on final documentation steps before ending.
:Document Findings;
:Update FMEA;
:Share Lessons Learned;
stop
@enduml
The stop keyword renders a double-circle symbol, signifying the termination of the activity diagram.
Why Use VPasCode for RCA?
Visual Paradigm’s VPasCode offers significant advantages over manual diagramming tools:
- Version Control Friendly: Text files are easy to diff and merge. You can track changes to your quality control process using Git.
- Rapid Prototyping: If you need to add a new decision node (e.g., “Check Warranty Status?”), you simply insert a line of code and save. The diagram regenerates instantly.
- Standardization: By using code, you enforce a consistent style. Every decision diamond looks the same, and every process box adheres to your organization’s formatting standards.