


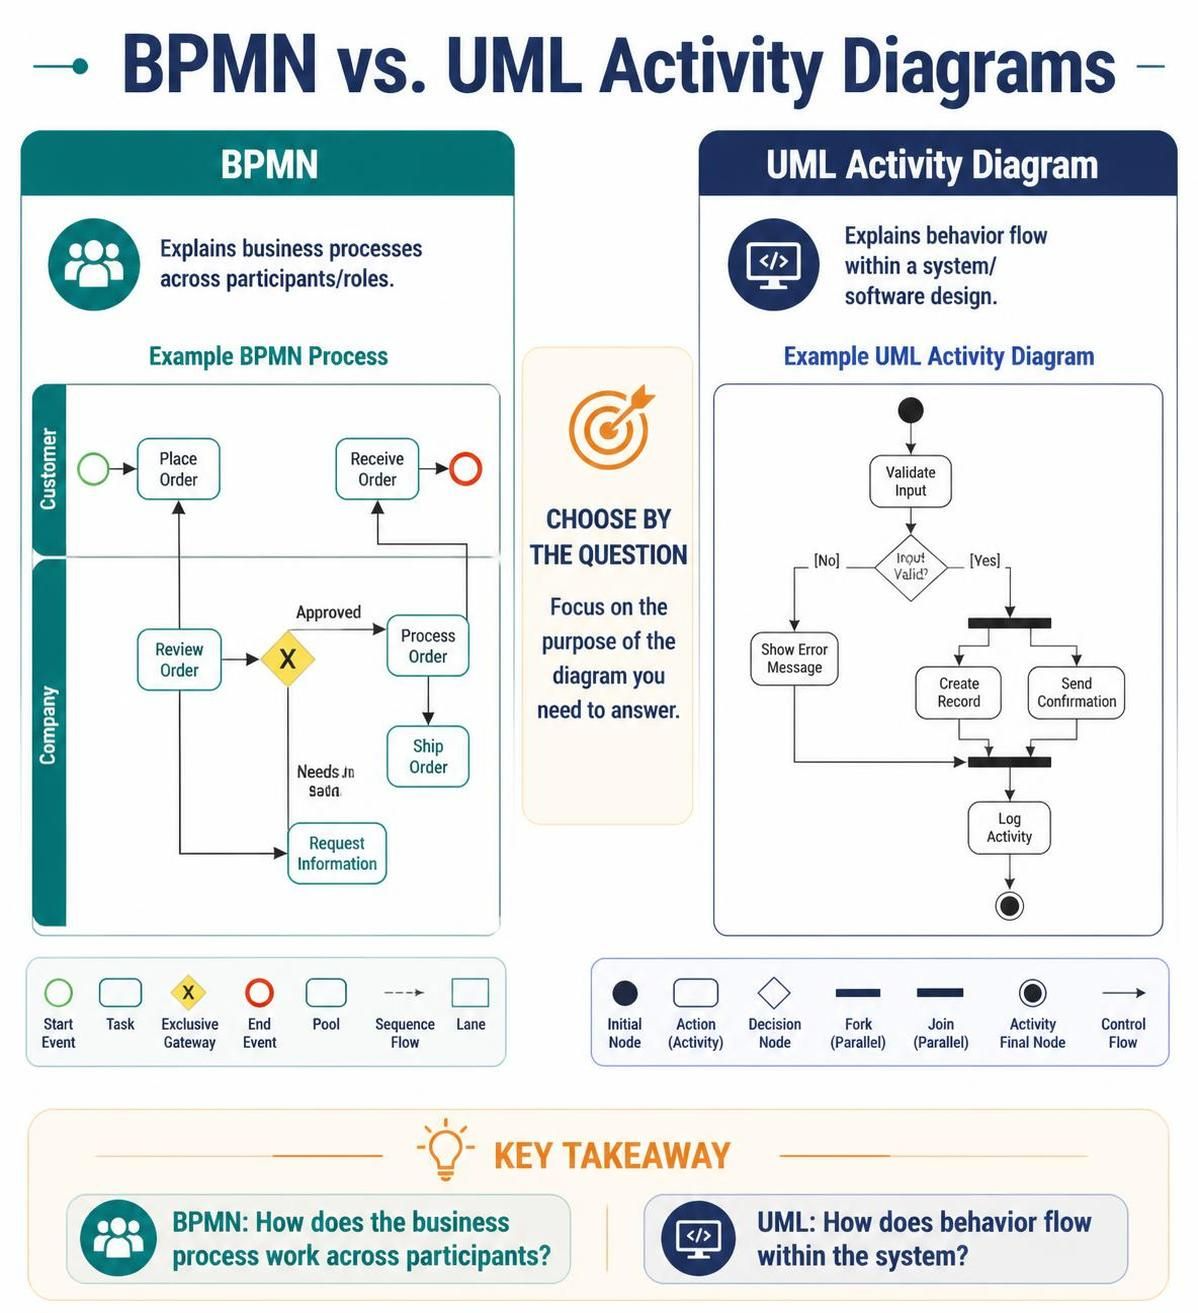
In the world of software engineering and business analysis, clarity is currency. When visualizing complex workflows, two heavyweights often compete for attention: BPMN (Business Process Model and Notation) and UML Activity Diagrams. Both are powerful tools capable of illustrating actions, decisions, and parallel paths, yet they serve fundamentally different masters.
This tutorial guides you through the architectural differences between these two modeling standards. We will explore when to use BPMN to map human interaction and when to deploy UML to design system behavior, ensuring you choose the right visual language for your specific architectural questions.
Understanding the Core Architectures
To understand which diagram to use, we must first understand the philosophy behind each notation system.
The Philosophy of BPMN
BPMN is designed with a process-centric philosophy. Its primary goal is to make business processes understandable to all stakeholders, from business analysts to IT developers. It focuses on the “Who” and the “How” of work moving across an organization.
- Focus: Cross-functional collaboration.
- Key Concept: Pools and Lanes. These containers represent participants (like a Customer or a Company) and the specific roles within them. This structure explicitly visualizes handoffs and message flows between different entities.
- Best For: Mapping workflows that involve multiple departments, external partners, or physical logistics.
The Philosophy of UML Activity Diagrams
UML (Unified Modeling Language) Activity Diagrams are rooted in object-oriented software design. While they look similar to flowcharts, they are designed to model the dynamic behavior of a specific system or algorithm. It focuses on the “Logic” of the software.
- Focus: Internal system logic and control flow.
- Key Concept: Forks and Joins. These bars represent the splitting and merging of control threads within a single object or system.
- Best For: Describing algorithms, user story logic, or the internal state transitions of a software component.
Architectural Deep Dive: BPMN
When you are modeling a business process, BPMN provides a robust vocabulary for “real world” interactions. Let’s look at the example of an Order Fulfillment process.
Visualizing Handoffs with Lanes
In a BPMN diagram, the vertical or horizontal lines dividing the diagram are called Lanes. They act as containers for specific participants. In our example, we have a Customer and a Company.
Participant: Customer
  |
  |-- [Event: Start]
  |-- [Task: Place Order]
  |
  <--- (Message Flow) --->
  |
Participant: Company
  |-- [Task: Review Order]
  |-- [Gateway: Exclusive Decision]
       |-- (Approved) --> [Task: Process Order] --> [Task: Ship Order]
       |-- (Needs Info) --> [Task: Request Info]
The power of BPMN lies in the Message Flow (often a dashed line with a circle or open arrow). This explicitly shows that the “Place Order” task is sent to the “Company” participant. This captures the context that a human or system in one department is handing off work to another.
The Exclusive Gateway
BPMN uses a diamond shape with an X (Exclusive Gateway) to represent a decision point where only one path can be taken. In our diagram, after reviewing the order, the system must decide: Is it approved? Or does it need more information? This logic is applied to the business state, not just a code variable.
Architectural Deep Dive: UML Activity Diagrams
Once the business requirement is defined, we often need to design the software that automates it. This is where the UML Activity Diagram shines. It strips away the human participants and focuses purely on the computational logic.
Logic and Control Flow
Consider the logic behind “Validating Input” for our order system. A UML diagram models this as a single unit of behavior.
[Initial Node] --> [Action: Validate Input]
                          |
                          v
                   [Decision Node: Input Valid?]
                  /                        \
              (No)                          (Yes)
                |                            |
                v                            v
        [Action: Show Error]      [Fork (Parallel)]
                                          /      \
                                         v        v
                              [Action: Create Record]  [Action: Send Confirmation]
                                         \        /
                                          \      /
                                           Join (Parallel)
                                            |
                                            v
                                      [Action: Log Activity]
                                            |
                                            v
                                        [Final Node]
Synchronization Bars (Forks & Joins)
Notice the thick black bars in the UML diagram. These represent synchronization.
- Fork (Parallel Split): The diagram splits into two parallel threads: Create Record and Send Confirmation. This implies the software can perform these actions simultaneously without waiting for one to finish the other.
- Join: The threads merge back together. The system cannot proceed to Log Activity until both the record creation and the confirmation sending are complete.
Decision Matrix: Which Tool Should You Use?
Do not choose a diagram based on which symbols you find prettier. Choose based on the specific question you are trying to answer.
| Question | Tool | Why? |
|---|---|---|
| How does work move across people, teams, or organizations? | BPMN | BPMN has specific elements for participants, handoffs (message flows), and organizational boundaries (pools/lanes). |
| How does a system or component perform a specific behavior? | UML Activity Diagram | UML fits naturally into the broader software design toolkit, focusing on control flow, data flow, and parallel processing within the code. |
| Both the operational process and the software behind it? | Both | Use them together. The BPMN defines the requirements; the UML defines the implementation. Link them by using shared identifiers (e.g., “Task A” in BPMN maps to “Action A” in UML). |
Conclusion
Mastering the distinction between BPMN and UML is a critical skill for system architects. BPMN helps you solve business problems by clarifying roles and responsibilities across an organization. UML helps you solve technical problems by defining the precise logic and concurrency of your software.
By using the right tool for the right question, you ensure that your documentation speaks clearly to both business stakeholders and the development team.