


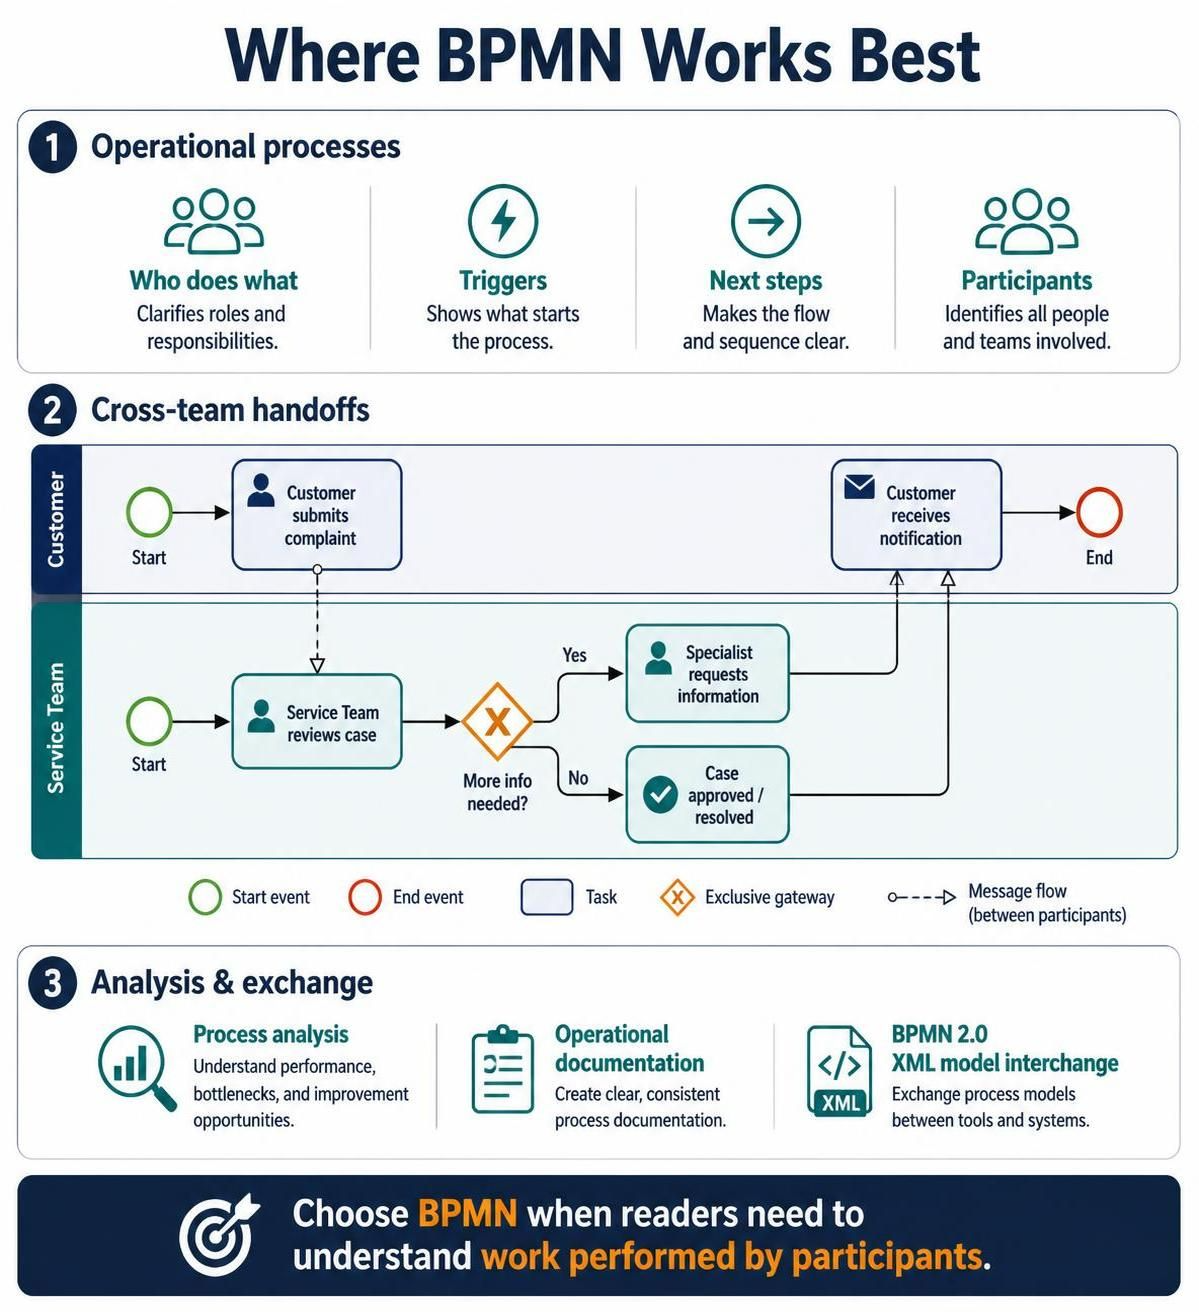
BPMN (Business Process Model and Notation) is the industry standard for visualizing complex workflows. It bridges the gap between business logic and technical implementation by providing a standardized visual language that stakeholders, business analysts, and developers can all understand. This tutorial explores the core architecture of BPMN, using a practical customer complaint scenario to demonstrate how to map operational processes, cross-team handoffs, and data exchanges.
1. The Core Architecture: Pools and Lanes
The foundation of any BPMN diagram is the Pool, which represents a participant in the process. This could be an entire organization, a specific department, or an external entity like a customer. To break down responsibilities within a participant, we use Lanes.
In our example, we have two distinct participants:
- The Customer: The external actor initiating the event.
- The Service Team: The internal organization handling the work.
Key Concept: By segregating tasks into specific lanes, BPMN explicitly clarifies who does what. This eliminates ambiguity regarding ownership and ensures that every step of the process has a designated actor.
2. Modeling the Flow: Events, Tasks, and Gateways
Once the structure is defined, we populate the lanes with the actual work. BPMN uses specific shapes to denote the nature of each step:
Start and End Events
Every process needs a beginning and an end.
- Start Event: Represented by a green circle. This is the trigger that initiates the process. In our scenario, the process starts when the “Customer submits complaint” or when the “Service Team reviews case.”
- End Event: Represented by a red circle. This signifies the completion of the process, such as the “Customer receives notification.”
Tasks
Tasks are the actual work performed. In BPMN, these are depicted as rounded rectangles.
- Customer submits complaint
- Service Team reviews case
- Specialist requests information
- Case approved / resolved
Gateways (Decision Logic)
Real-world processes are rarely linear; they involve decisions. Gateways control the flow of the process. The diagram features an Exclusive Gateway (the yellow diamond with an ‘X’), which forces a choice between paths.
Consider the decision point after the “Service Team reviews case”:
- Yes (More info needed): The flow moves to the “Specialist requests information” task.
- No (Case resolved): The flow moves directly to “Case approved / resolved.”
Sequence Flows vs. Message Flows
It is crucial to distinguish how elements connect:
- Sequence Flow (Solid Line): Indicates the order of activities within the same participant (e.g., from the Start Event to the Task).
- Message Flow (Dashed Line): Represents communication between different participants. For example, the dashed arrow connecting the “Customer submits complaint” task to the “Service Team reviews case” task indicates a message being sent from the customer to the service team.
3. Advanced Capabilities: Analysis and Interchange
Beyond simple visualization, BPMN 2.0 is designed for operational analysis and tool integration. Because BPMN has a strict XML format, it allows for seamless exchange between different modeling tools (like Visual Paradigm).
This capability supports:
- Process Analysis: Identifying bottlenecks by analyzing the paths and wait times.
- Operational Documentation: Creating clear, consistent guides for employees.
- Tool Interchange: Exporting the model to execute it or import it into a workflow engine.
Summary
BPMN is the best choice when your goal is to understand the work performed by participants. By utilizing Pools, Lanes, Gateways, and Message Flows, you create a diagram that is not just a picture, but a functional specification of your business operations.