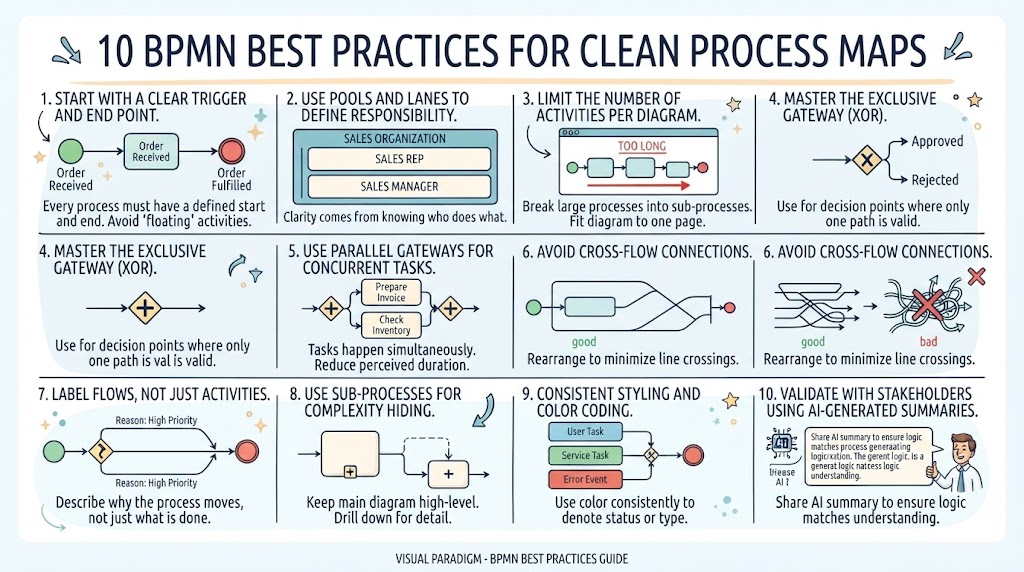
In the world of business process management, clarity is currency. A poorly constructed diagram can lead to confusion, miscommunication, and implementation errors. Business Process Model and Notation (BPMN) is the industry standard for visualizing processes, but knowing the syntax is only half the battle. The other half is mastering the art of diagramming—creating maps that are not just technically correct, but visually intuitive and easy to maintain.
As a technical tutor, I often see diagrams that are functionally accurate but visually overwhelming. This tutorial will walk you through 10 essential best practices to transform your BPMN diagrams from cluttered technical artifacts into clean, professional process maps. Whether you are using Visual Paradigm or another modeling tool, these principles apply universally.
Part 1: Setting the Stage—Scope and Ownership
Before drawing a single shape, you must define the boundaries of your process. This ensures stakeholders immediately understand what is being discussed and who is responsible for it.
1. Define Clear Triggers and End Points
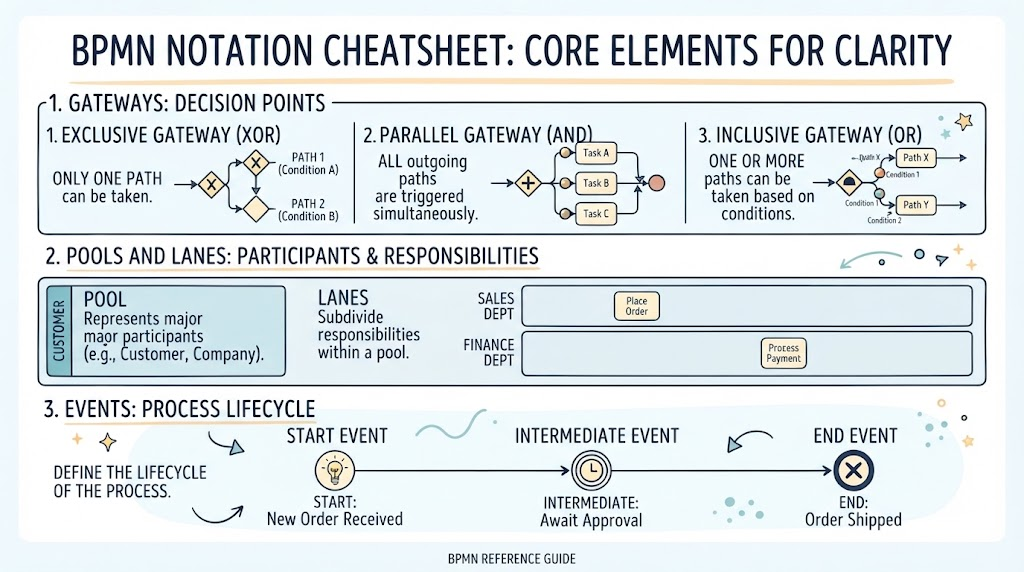
Every process must have a definitive beginning and a definitive end. Avoid “floating” activities that seem to appear out of nowhere or disappear into the void. A clean process map acts like a story: it has a setup and a resolution.
- Start Events: Use explicit start events to frame the scope. Examples include Message Received (e.g., an email arrives) or Timer Fired (e.g., a monthly report is due).
- End Events: Ensure every path concludes. Use explicit end events like Process Completed for success or Error Ended for exceptions. This provides closure to the logic.
2. Use Pools and Lanes for Responsibility Clarity
Confusion often arises when it is unclear who is doing what. Visual separation is the key to resolving this ambiguity.
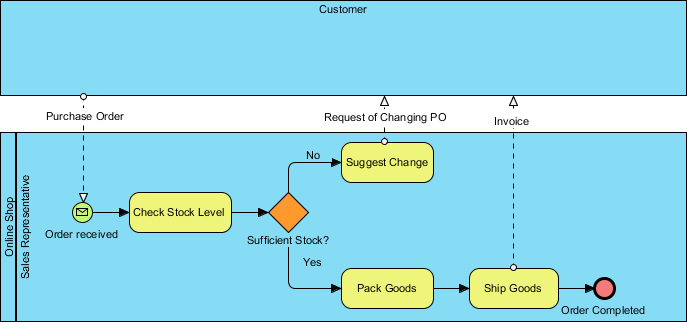
- Pools: Use pools to represent distinct organizations or major entities. If a process involves a customer and a vendor, they should be in separate pools.
- Lanes: Within a pool, use lanes to distinguish between departments or specific roles. For example, a “Sales Organization” pool might have lanes for “Sales Rep” and “Sales Manager.”
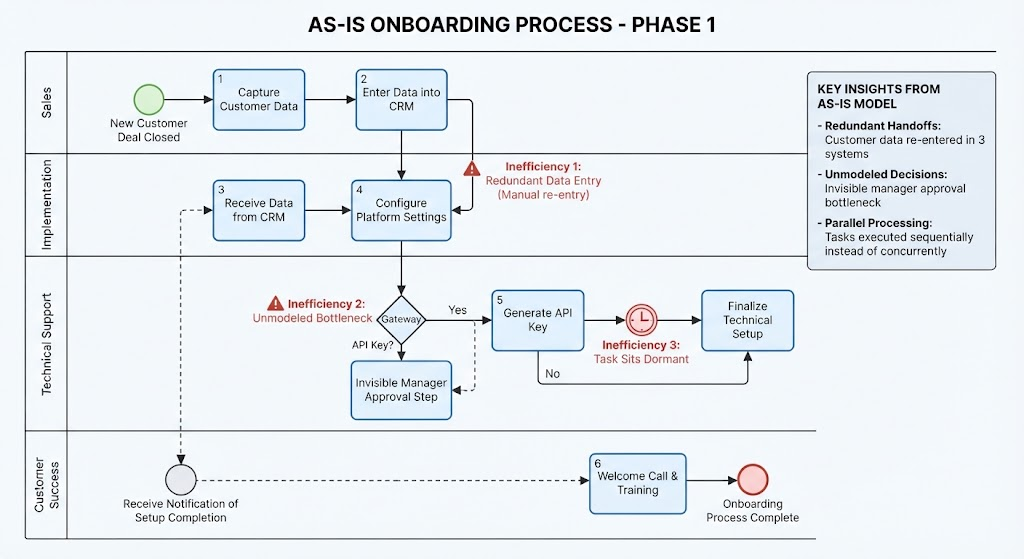
This structure allows a viewer to instantly scan a diagram vertically to see the actions of a specific role, or horizontally to see the hand-offs between them.
Part 2: Managing Cognitive Load and Complexity
One of the biggest mistakes modelers make is trying to fit an entire enterprise workflow onto a single page. This leads to diagrams that are impossible to navigate. You must learn to manage complexity through abstraction.
3. Limit the Number of Activities per Diagram
Cognitive ease is critical for process adoption. If your diagram requires the user to scroll horizontally for more than two screens, it is too complex. The goal is to keep the entire diagram visible on a single page or screen view.
If a process is too large, do not compress it. Instead, break it down. Use sub-processes to encapsulate large chunks of logic, keeping the main diagram high-level and readable.
8. Use Sub-Processes for Complexity Hiding
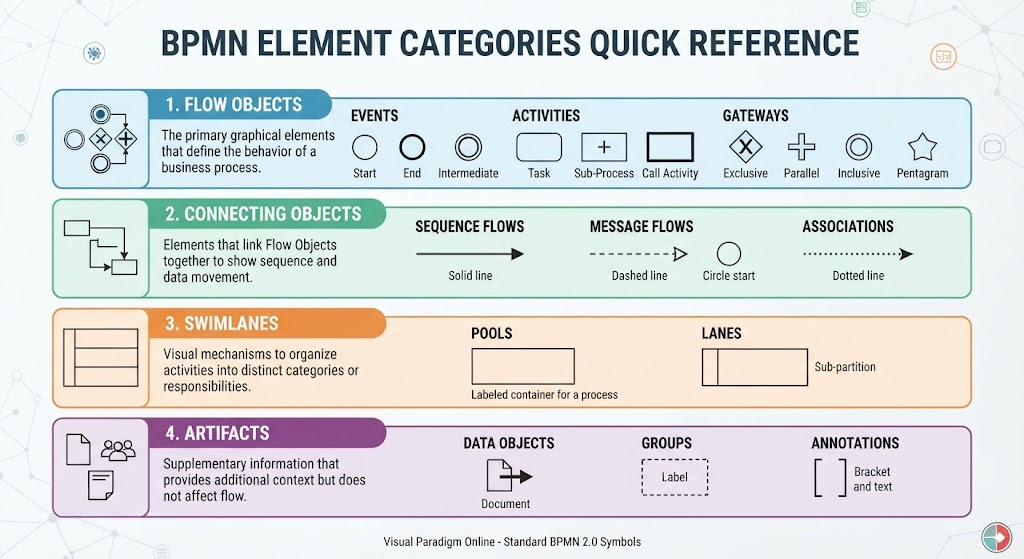
Not every stakeholder needs to see the granular details of every step. If a set of activities forms a logical unit that is detailed elsewhere (or is too complex for the current context), collapse it into a Sub-Process.
This technique allows you to “hide” complexity. A stakeholder looking at the high-level view sees a clean box labeled “Fulfill Order,” while a technical analyst can drill down into the sub-process to see the specific inventory checks and shipping logic. This duality keeps your documentation organized.
Part 3: Mastering Logic and Flow Control
The “engine” of a BPMN diagram is its logic. How does the process make decisions? How does it handle parallel work? Understanding gateways is essential for accurate modeling.
4. Master the Exclusive Gateway (XOR)
When your process reaches a decision point where only one path is valid, you must use an Exclusive Gateway (often represented by a diamond with an ‘X’).
Crucially, you must clearly label the outgoing flows. Do not leave conditions implicit. If a task leads to a gateway, one path might be labeled “Approved” and the other “Rejected.” This explicit labeling prevents the reader from guessing the logic.
5. Use Parallel Gateways for Concurrent Tasks
Real-world business rarely happens in a strictly linear sequence. Often, tasks happen simultaneously. To model this accurately, use a Parallel Gateway.
When you split a flow into parallel branches, you are indicating that tasks can happen at the same time without dependency. For example, after an order is placed, the system might simultaneously notify the warehouse and send an email to the customer. To maintain flow integrity, ensure that all parallel branches eventually rejoin using another Parallel Gateway to synchronize the flow before continuing.
Part 4: Visual Hygiene and Aesthetics
Even a perfectly logical diagram can fail if it is visually noisy. Visual Paradigm and other tools offer auto-layout features, but manual tweaking often yields the cleanest results.
6. Avoid Cross-Flow Connections
Lines crossing each other create visual noise and make it difficult to trace the path of execution. This is known as “spaghetti modeling.”
Always rearrange your activities and gateways to minimize line crossings. A clean diagram looks like a flowing river, not a tangled knot. If lines must cross, consider using a sub-process to isolate the crossing logic.
7. Label Flows, Not Just Activities
Activities describe what is done, but sequence flows describe why the process moves in a certain direction. While activity labels are mandatory, flow labels are often neglected.
Labeling flows, especially those exiting gateways, provides critical context. For instance, a flow exiting a decision point might be labeled “Reason: High Priority.” This turns your diagram from a static map into a dynamic narrative that explains the decision logic.
9. Use Consistent Styling and Color Coding
Visual consistency helps the human brain categorize information instantly. Use color consistently to denote status or task type.
- Blue: Often used for User Tasks (human interaction).
- Green: Often used for Service Tasks (system automation).
- Red: Often used for Error Events (exceptions).
By adhering to a standard style set (available in tools like Visual Paradigm), you ensure your entire organization’s diagrams look uniform and professional.
Part 5: Validation and Future-Proofing
The final step in creating a clean process map is ensuring it actually represents reality. A diagram that looks good but fails to capture the business logic is useless.
10. Validate with Stakeholders Using AI-Generated Summaries
Visual inspection has limits. Logic errors can hide in plain sight. Before finalizing your diagram, leverage modern tools to generate a text-based summary of your diagram.
Share this summary with stakeholders to ensure the logic matches their understanding. This step catches logical errors that visual inspection might miss, bridging the gap between technical modeling and business understanding.
Conclusion
By following these 10 best practices, you move beyond simply drawing boxes and arrows. You are engineering clear, maintainable, and valuable business assets. Start with clear triggers, manage your complexity with sub-processes, master your gateways, and prioritize visual hygiene. The result will be process maps that drive efficiency and clarity across your organization.