In the world of business process management, clarity is currency. The Business Process Model and Notation (BPMN) standard serves as the universal language for visualizing complex workflows. Whether you are a business analyst, a developer, or a process owner, understanding how to construct a basic process flow is the first step toward digital transformation.
This tutorial explores the fundamental architecture of a BPMN diagram. We will dissect a standard process flow—from initiation to completion—by examining the core elements: Events, Tasks, Gateways, and Sequence Flows.
The Architecture of a Process Flow
Imagine a process as a river. It starts at a source, flows through various channels where work is done, encounters forks in the road where decisions must be made, and finally drains into a destination. In BPMN, this river is represented by a series of specific graphical objects connected by directional arrows.
1. The Starting Point: Start Events
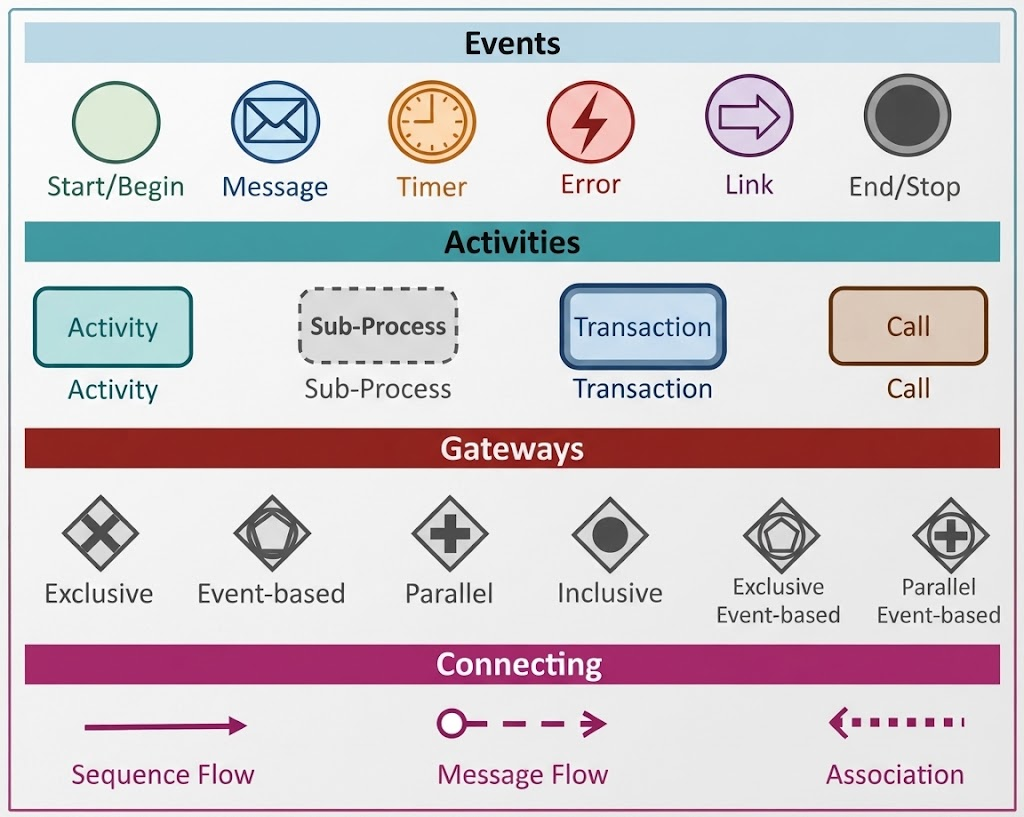
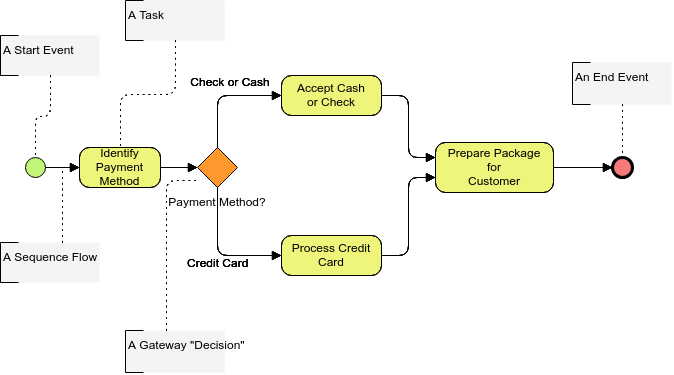
Every process needs a trigger. The Start Event is the “green light” that initiates the workflow. In the diagram, this is represented by a green circle.
- Visual Representation: A circle with a thin outline.
- Function: It signifies the moment the process begins. In a real-world scenario, this could be a customer placing an order, a system receiving a notification, or a manual trigger like a “Submit” button click.
- Key Concept: A process should typically have exactly one start event.
2. The Work: Tasks
Once the process is triggered, work must be performed. These are called Tasks. In BPMN, a task is the most basic unit of work—a single activity that cannot be broken down further within the scope of that specific diagram.
Looking at our example diagram, we see three distinct tasks, all depicted as rounded rectangles filled with a light yellow color:
- Identify Payment Method: This is the first step after the start event. The system or user must determine how the customer intends to pay.
- Accept Cash or Check: A specific branch of work handling traditional payment methods.
- Process Credit Card: A different branch handling digital financial transactions.
Best Practice: Always use clear, action-oriented verbs (like “Identify,” “Accept,” or “Process”) in your task labels to ensure the diagram is self-explanatory.
3. The Logic: Gateways
Real-world processes are rarely linear; they require decision-making. The Gateway is the shape that controls the divergence and convergence of the process flow. In our diagram, we see an orange diamond, which represents a Exclusive Gateway.
- Function: This acts as a traffic cop. It asks a question: “Is the payment method a credit card or not?”
- Logic: It ensures that only one path is taken based on a condition. If the condition is true, the flow goes one way; if false, it goes another. It splits the flow into mutually exclusive paths.
- Convergence: Later in the process, gateways often merge paths back together, ensuring that regardless of which payment method was chosen, the process continues to the next stage.
4. The Path: Sequence Flows
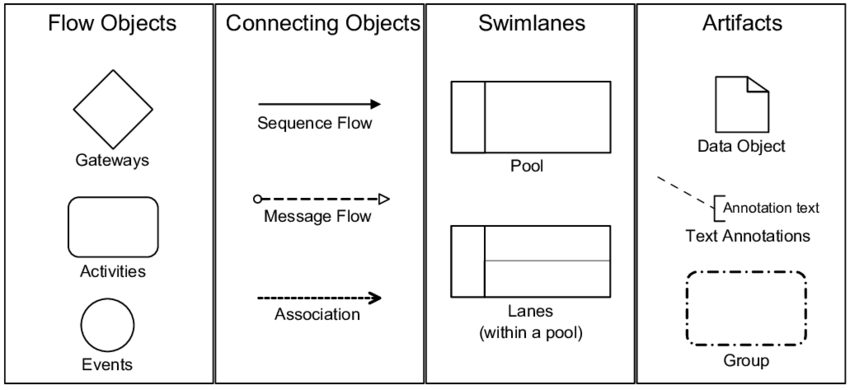
Connecting all these elements are the Sequence Flows. These are the arrows that indicate the order of performance.
- Visuals: Thin lines with arrowheads.
- Direction: Flow is always top-to-bottom or left-to-right. They guide the “river” from the Start Event, through the decision points (Gateways), and towards the End Event.
5. The Destination: End Events
The process cannot run forever. It must conclude. The End Event is depicted as a red circle.
- Function: It signifies that the process is complete. In our example, after the “Prepare Package for Customer” task, the process ends because the order has been fulfilled.
- Importance: Without an end event, a model is considered incomplete and might lead to confusion about where the responsibility ends.
Case Study: The Payment Processing Workflow
To fully grasp these concepts, let’s walk through the specific logic of the diagram provided in the image. This is a classic “Split-Decision-Split” pattern often seen in e-commerce systems.
Step 1: Initiation
The process begins at the Start Event (Green Circle). A customer submits an order.
Step 2: Identification
The workflow moves via Sequence Flow to the first task: Identify Payment Method. The system checks the data.
Step 3: The Decision (Gateway)
The flow hits the Orange Diamond Gateway. Here, the system evaluates the payment type:
- Path A: If the payment is Cash or Check, the flow diverts to the task Accept Cash or Check.
- Path B: If the payment is a Credit Card, the flow diverts to the task Process Credit Card.
Step 4: Convergence
After the specific payment tasks are completed, the flows converge back together. This ensures that both cash and credit card payments result in the same subsequent outcome.
Step 5: Fulfillment
The unified flow proceeds to the task Prepare Package for Customer. This is the physical fulfillment of the order.
Step 6: Completion
Once the package is prepared, the flow reaches the End Event (Red Circle), marking the successful completion of the transaction.
Best Practices for BPMN Modeling
As you begin to build your own diagrams, keep these technical guidelines in mind to ensure your models are professional and easy to understand:
- Keep it Linear where Possible: While gateways add necessary logic, avoid over-complicating diagrams. Use them only when a decision is required.
- Consistent Naming: Use the same terminology for events and tasks across all diagrams. If you call it “Order Processing” in one diagram, don’t call it “Order Fulfillment” in another unless they are distinct processes.
- Visual Hierarchy: Use color coding sparingly but effectively. For example, green for “Go/Start”, red for “Stop/End”, and yellow for “Activity” helps stakeholders quickly scan the diagram.
- One Start, One End: Always ensure your diagram has a clear beginning and a clear end to prevent “orphaned” tasks.
Conclusion
Understanding the building blocks of BPMN—Start Events, Tasks, Gateways, and End Events—is the foundation of process architecture. By mastering these elements, you can translate complex business rules into clear, actionable visual maps that drive efficiency and clarity.