In the realm of business process modeling, few concepts are as critical—and often misunderstood—as the Collaboration Diagram. Unlike a simple flowchart that tracks a single individual’s tasks, a Collaboration diagram (often referred to as a “Swimlane” diagram in the Business Process Model and Notation, or BPMN, standard) visualizes the complex web of interactions between different entities.
This article serves as a comprehensive tutorial on how to architect, model, and interpret these diagrams. We will use the provided medical appointment scenario to illustrate how to map the end-to-end journey of a patient and a healthcare provider.
1. The Foundation: Understanding the “Pool” Concept
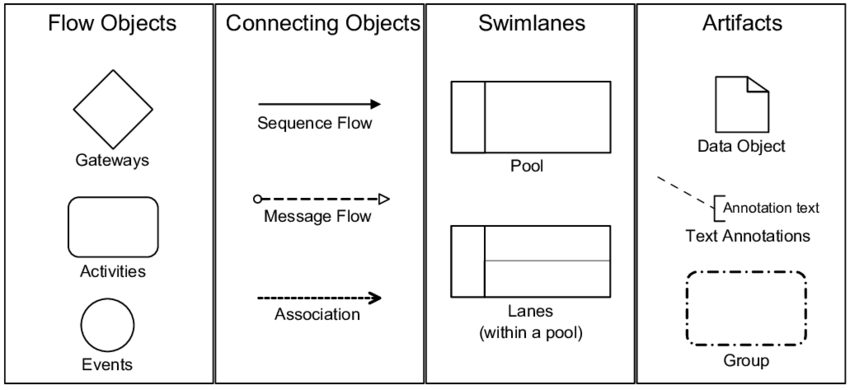
The core architectural element of a Collaboration diagram is the Pool. A Pool represents a distinct business entity. This entity can be an entire organization (like a bank), a specific department (like HR), or even a specific system. In a diagram, a Pool acts as a container.
Why use Pools?
They provide a visual boundary that clarifies responsibility. If an action happens inside the “Patient” pool, it is a private action of the patient. If it happens in the “Receptionist” pool, it belongs to the receptionist. This separation is vital for identifying bottlenecks and hand-offs.
Case Study: The Medical Scenario
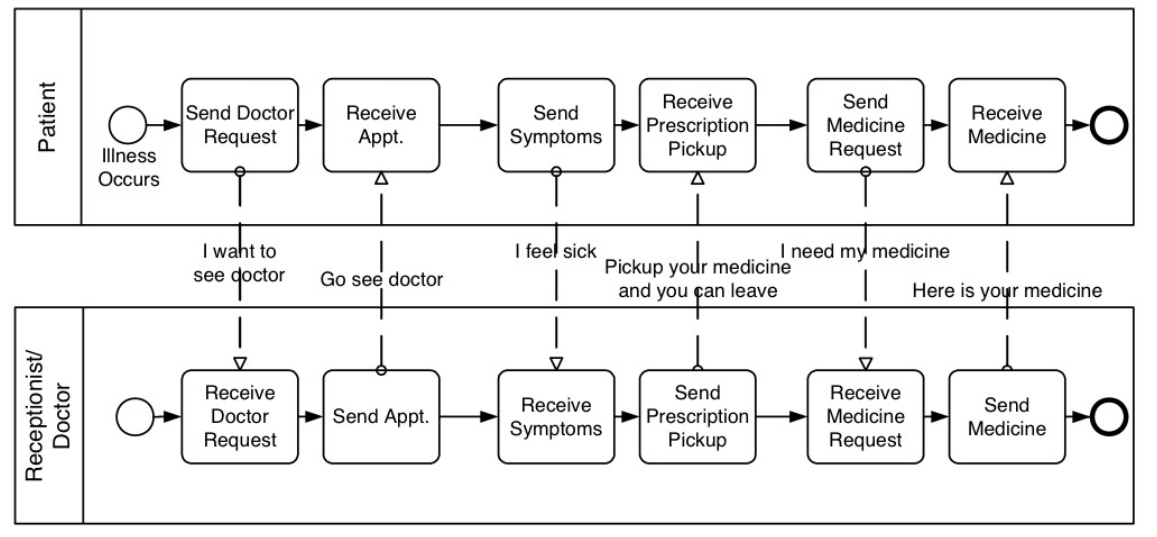
In the diagram provided, we see two distinct Pools:
- Pool 1: Patient – Represents the individual seeking care.
- Pool 2: Receptionist/Doctor – Represents the service provider organization.
2. The Workflow Within: Private Processes
Inside each Pool, you will find a sequence of tasks connected by solid lines. These are called Sequence Flows. They represent the internal logic of that specific entity.
Key Rule: Sequence flows (solid lines) never cross pool boundaries. If a line goes from the top pool to the bottom pool, it is not a sequence flow; it is a message flow.
Let’s trace the Private Process of the Patient:
- Start Event: The process begins with an Intermediate Catch Event labeled “Illness Occurs.” This is a standard start point triggered by an external event.
- Task: Send Doctor Request – The patient initiates contact.
- Task: Receive Appt. – The patient waits for a response.
- Task: Send Symptoms – The patient provides necessary context.
- Task: Receive Prescription Pickup – The patient gets instructions.
- Task: Send Medicine Request – The patient requests the actual medication.
- End Event: The patient Receives Medicine, completing their private journey.
3. The Interaction: Message Flows
This is the heart of the Collaboration diagram. The dashed lines connecting the two pools represent the Message Flows. These lines signify the exchange of information or physical items between the entities.
The “Gate” Mechanism:
Notice the small open circles where the dashed lines meet the tasks. In BPMN, these are called Message Flow Paddles (or Message Start/End Events). They indicate that a task is either waiting for a message to arrive or has just sent one.
Tracing the Dialogue:
A Collaboration diagram is essentially a script. Let’s read the interaction between the Patient and the Receptionist:
- Step 1: The Patient sends a
I want to see doctormessage. This triggers the Receptionist’s task: Receive Doctor Request. - Step 2: The Receptionist responds by Sending Appt.. The Patient receives this via the Receive Appt. task.
- Step 3: The Patient sends
Go see doctorandI feel sick(symptoms). The Receptionist receives these inputs to prepare the medical record. - Step 4: The Receptionist sends
Pickup your medicine and you can leave. This triggers the Patient’s Receive Prescription Pickup task. - Step 5: The Patient sends
I need my medicine. The Receptionist processes this as Receive Medicine Request. - Step 6: Finally, the Receptionist sends
Here is your medicine, completing the interaction.
4. Analyzing the Architecture: Why This Matters
Why do we model this instead of just describing it in text? There are three critical technical benefits:
A. Identifying Hand-off Points
The dashed lines highlight exactly where the process stops for one party and starts for another. In our example, the “Hand-off” from Patient to Doctor is the Send Doctor Request and Receive Doctor Request. If this step takes too long, the entire process is delayed.
B. Visualizing Latency
Notice that between “Send Doctor Request” and “Receive Appt.”, the Patient is in a waiting state. Similarly, between “Receive Prescription Pickup” and “Send Medicine Request”, the Patient must physically travel to pick up the medicine. The diagram makes these “waiting times” visible, which is crucial for process optimization.
C. Separation of Concerns
By keeping the Pools separate, we can easily see what the Patient does vs. what the Doctor does. If the “Receptionist” pool is overloaded, we know we might need to hire more staff. If the “Patient” pool has too many steps, we know the patient experience is too complex.
5. Conclusion
A Collaboration diagram is more than just a drawing; it is a contract of interaction between entities. By strictly following the rules—using Pools to separate ownership, Sequence Flows for internal logic, and Message Flows (dashed lines) for communication—you can create a robust blueprint for complex business scenarios like supply chains, loan applications, or medical treatments.
When you look at the diagram again, remember: the solid lines tell the story of what each person is doing, while the dashed lines tell the story of how they talk to each other.