In the realm of business process management and systems architecture, the ability to visualize, analyze, and redesign workflows is paramount. Whether you are a software engineer looking to refactor legacy code, a business analyst streamlining operations, or a project manager optimizing logistics, you rely on the As-Is and To-Be Analysis framework. This methodology bridges the gap between current inefficiencies and future excellence.
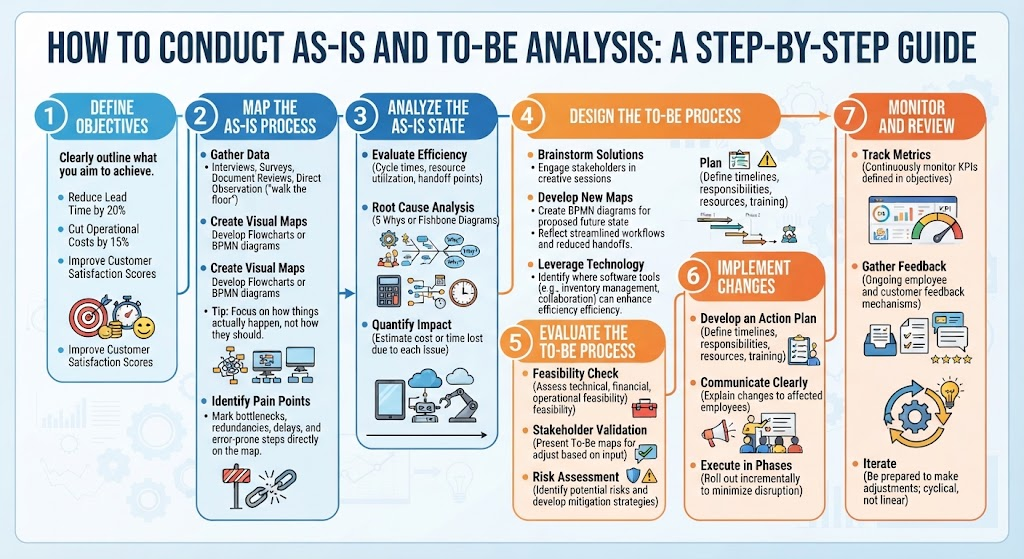
This tutorial breaks down the seven-phase lifecycle of this analysis, moving from defining clear objectives to the iterative monitoring of new systems.
Phase 1: Define Objectives Clearly
Before drawing a single diagram or analyzing a single data point, you must establish the North Star of your project. Ambiguous goals lead to scope creep and ineffective solutions. In systems analysis, this phase is akin to defining the functional requirements before writing code.
- Set Specific Targets: Instead of vague goals like “work better,” use measurable metrics. Examples include:
- Reducing lead time by 20%.
- Cutting operational costs by 15%.
- Improving customer satisfaction scores (CSAT) to a specific threshold.
- The “Why”: Clearly articulate why these objectives matter to the organization to ensure alignment across departments.
Phase 2: Map the As-Is Process
The “As-Is” state represents the reality of your current operations. A common pitfall in systems architecture is mapping the process as it should be rather than as it is. This phase requires rigorous data collection to uncover the truth.
1. Gather Data
You cannot model a system you do not understand. Use a mix of qualitative and quantitative methods:
- Interviews & Surveys: Gather qualitative insights from stakeholders.
- Document Reviews: Analyze standard operating procedures (SOPs).
- Direct Observation: “Walk the floor” to see how employees actually interact with tools and each other.
2. Create Visual Maps
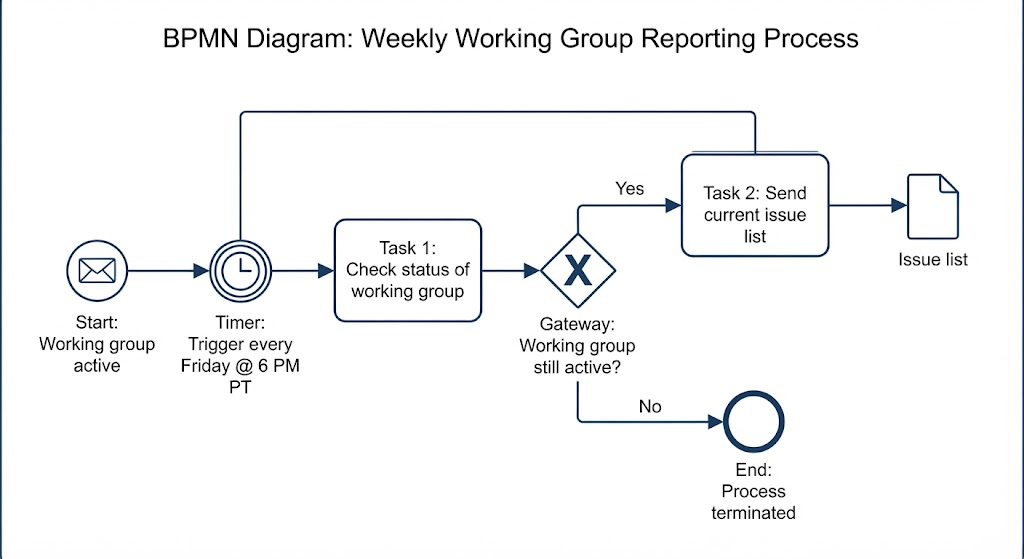
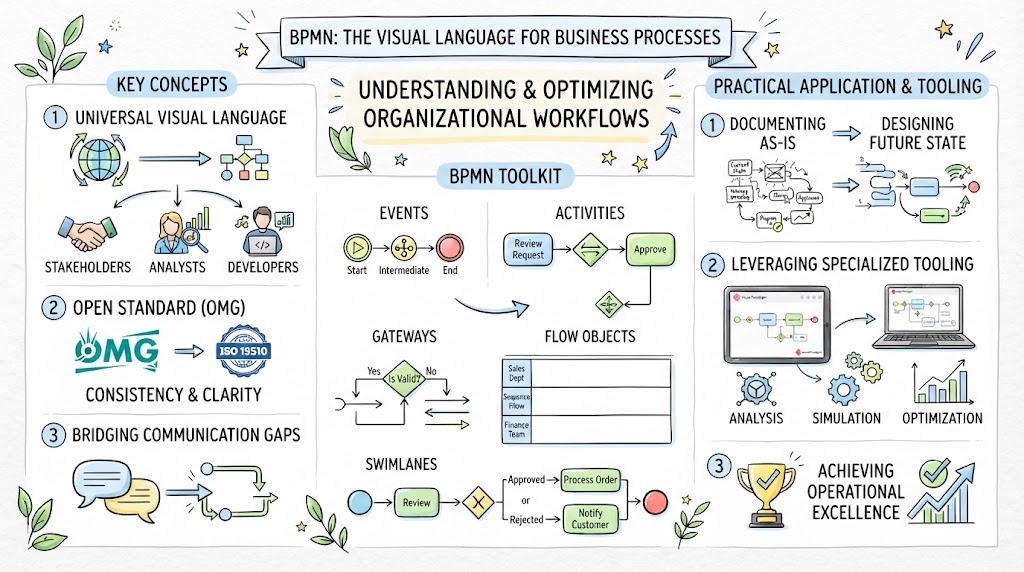
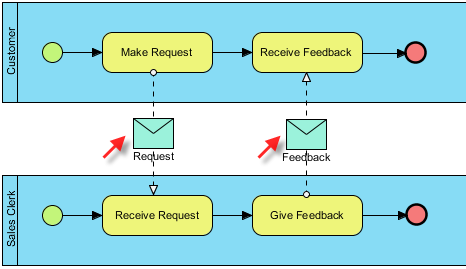
Data needs to be visualized. In technical modeling, this often involves creating Flowcharts or Business Process Model and Notation (BPMN) diagrams. These diagrams serve as the blueprint of the current system architecture.
3. Identify Pain Points
Once the map is drawn, overlay the issues. Mark bottlenecks, redundancies (duplicate work), delays, and steps where errors frequently occur. This visual layer is crucial for the next phase of analysis.
Phase 3: Analyze the As-Is State
Now that you have the map, you must diagnose the system. This is the “root cause analysis” phase of your project.
Evaluate Efficiency
Quantify the health of the current process. Look at:
- Cycle Times: How long does a transaction take from start to finish?
- Resource Utilization: Are employees overworked or underutilized?
- Handoff Points: Where does work pass between people or systems? (High handoff points often indicate high risk of error).
Root Cause Analysis
Don’t just treat symptoms; treat the disease. Use techniques like the “5 Whys” or Fishbone Diagrams to dig deep. For example, if a report is late, ask “Why?” five times to find that the root cause is a manual data entry error in the legacy system, not laziness.
Quantify Impact
Translate inefficiencies into business value. Estimate the cost or time lost due to each identified issue to build a business case for change.
Phase 4: Design the To-Be Process
This is the creative and technical design phase. Here, you move from diagnosis to prescription, designing the future state architecture.
- Brainstorm Solutions: Engage stakeholders to propose improvements. Consider automation (using scripts or bots), elimination of non-value-added steps, or parallel processing.
- Develop New Maps: Create new BPMN diagrams for the proposed future state. Ensure these maps reflect streamlined workflows and reduced handoffs.
- Leverage Technology: Identify where software tools—such as inventory management systems or collaborative platforms—can replace manual friction.
Phase 5: Evaluate the To-Be Process
A brilliant theoretical design is useless if it cannot be implemented. This phase acts as a “feasibility study” for your new system.
Feasibility Check
Assess three key areas:
- Technical: Do we have the infrastructure?
- Financial: Can we afford the implementation?
- Operational: Will it fit into our daily culture?
Stakeholder Validation & Risk Assessment
Present the To-Be maps to key stakeholders. Their buy-in is critical. Additionally, perform a risk assessment to identify potential failure points in the new process and develop mitigation strategies before you begin.
Phase 6: Implement Changes
The execution phase transforms the design into reality. In systems engineering, this is the deployment phase.
- Develop an Action Plan: Define timelines, responsibilities, resource allocation, and training needs. A detailed project plan is your roadmap here.
- Communicate Clearly: Explain the changes to all affected employees. Emphasize the benefits (e.g., less overtime, fewer errors) and address concerns to reduce resistance.
- Execute in Phases: If possible, roll out changes incrementally (pilot testing) rather than a “big bang” launch to minimize disruption.
Phase 7: Monitor and Review
The lifecycle of process improvement is cyclical, not linear. Once the new system is live, the work is not done.
- Track Metrics: Continuously monitor the KPIs defined in Phase 1. Did you achieve the 20% reduction in lead time?
- Gather Feedback: Establish mechanisms for ongoing employee and customer feedback.
- Iterate: Be prepared to make adjustments. Processes degrade over time, and the market changes. Continuous improvement (Kaizen) is the goal.
By following this structured approach, you ensure that your transition from As-Is to To-Be is not just a theoretical exercise, but a measurable, value-driven transformation.