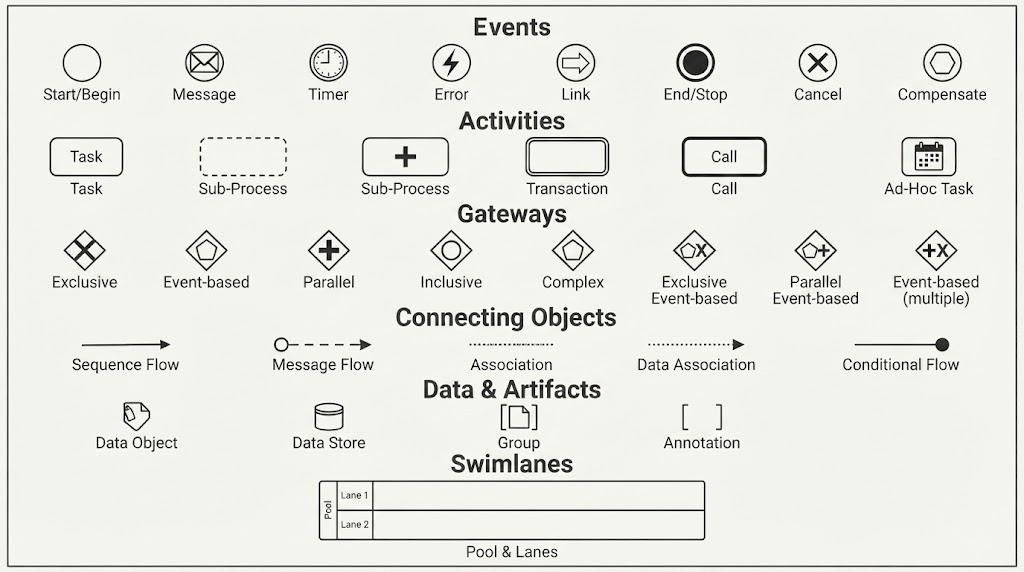
In the world of systems engineering and business analysis, communication is everything. How do we ensure that a developer understands a business requirement, or how does a stakeholder visualize a complex workflow? The answer lies in a universal language known as BPMN (Business Process Model and Notation).
This tutorial serves as your comprehensive guide to the visual grammar of BPMN. By breaking down the standard symbols into their core components, we will transform a static diagram into a dynamic understanding of system architecture, process logic, and data flow.
The Core Philosophy: Visualizing the Invisible
Before diving into specific shapes, it is crucial to understand that BPMN is not just about drawing pretty pictures. It is a method for modeling the behavior of a system. Whether you are mapping a customer’s journey through an e-commerce site or defining the logic for an automated banking transaction, BPMN provides a structured way to document the “who, what, when, and how” of a process.
The standard is built upon four fundamental building blocks that work together to create a complete narrative.
1. Flow Objects: The Heart of the Process
Flow objects are the primary elements used to describe a process. They represent the actions, decisions, and triggers that move a process forward. Think of these as the actors and events in a play.
- Events: These are circles that represent “things that happen.” They are passive elements that trigger or result from activities.
- Start/Begin: The trigger that initiates the process (e.g., a user clicks “Submit”).
- End/Stop: The termination point of the process (e.g., Order Completed).
- Intermediate Events: Occurrences that happen during the process, such as receiving a message, a timer expiring, or an error occurring.
- Activities: These are rounded rectangles representing work that needs to be done.
- Task: The smallest unit of work (e.g., “Calculate Tax”).
- Sub-Process: A container that allows you to group related tasks together, keeping the main diagram clean while detailing complex logic inside.
- Call Activity: A reference to a process defined elsewhere.
- Gateways: These diamonds represent decision points. They control the divergence (splitting) and convergence (merging) of the process flow.
- Exclusive (XOR): A decision point where only one path is taken (e.g., “Is Order Valid? Yes/No”).
- Parallel (AND): A point where the process splits into multiple simultaneous paths (e.g., Send Email AND Send SMS).
- Inclusive (OR): A split where one or more paths may be taken based on conditions.
2. Connecting Objects: The Arteries of the System
Flow objects do not exist in a vacuum; they need connections to function. Connecting objects define the order and relationships between the flow objects.
- Sequence Flow: A solid line with a classic arrowhead. This represents the order of activities in a single process. It is the default flow of control.
- Message Flow: A dashed line with a hollow circle at the start and an arrow at the end. This is critical in multi-party systems (like Pools). It indicates a message being passed between different participants or systems (e.g., from a Customer to a Bank).
- Association: A dotted line used to link artifacts (like text or data) to flow objects to provide context without affecting the logic.
3. Swimlanes: Organizing Responsibility
Complex systems involve multiple actors. Swimlanes (specifically Pools and Lanes) are the architectural containers that organize the process by role, department, or system.
- Pools: Represent distinct participants in a process. A single pool contains one process, while multiple pools (often arranged side-by-side) represent interactions between different organizations or systems.
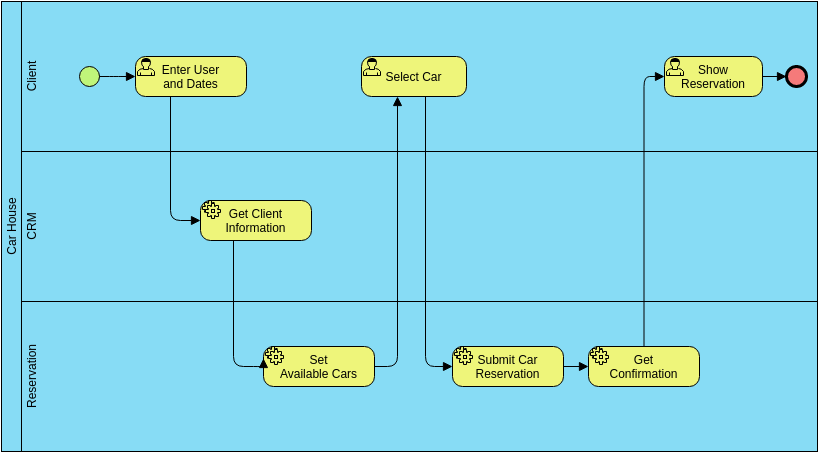
- Lanes: Sub-divisions within a pool. Lanes organize activities by specific roles (e.g., “Sales,” “Logistics,” “IT Support”) within a single organization. This ensures that every task is clearly assigned to a responsible entity.
4. Artifacts: Adding Context
Finally, diagrams need annotations to be fully understood. Artifacts provide additional information without strictly controlling the flow of the process.
- Data Objects: Represent the data required or produced by an activity (e.g., “Invoice,” “Customer List”).
- Data Stores: Represent a repository where data is stored (e.g., a database or a filing cabinet).
- Groups: Visual boundaries that group activities together for logical organization.
- Annotations: Text notes attached to elements via dashed lines to explain complex logic.
Putting It All Together
When you look at a BPMN diagram, you are essentially reading a story. You start at a Start Event, move through Activities assigned to specific Lanes, encounter Gateways that dictate the path based on logic, and finally reach an End Event. The Message Flows tell you how this story interacts with the outside world.
By mastering these four core building blocks, you gain the ability to design robust system architectures that are not only technically sound but also easily understood by all stakeholders involved.