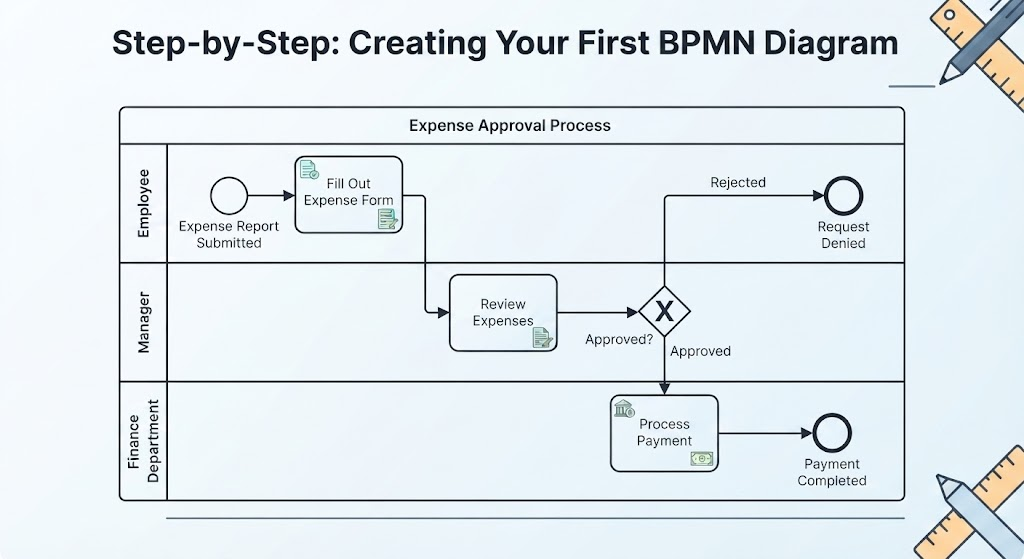
Business Process Model and Notation (BPMN) is the industry standard for visualizing, analyzing, and improving workflows. Whether you are a business analyst, a software developer, or a process owner, understanding how to translate complex operational rules into a clear visual diagram is a critical skill. In this tutorial, we will deconstruct a practical Employee Expense Approval Process to demonstrate how to build a professional BPMN diagram from scratch.
Why Use BPMN?
Before diving into the technical steps, it is essential to understand the value of the architecture we are building. BPMN diagrams serve as a universal language between business stakeholders and technical teams. By using standardized symbols, we eliminate ambiguity regarding who does what, when, and why. This ensures that the “Expense Approval Process” is executed consistently, reducing errors and bottlenecks.
Step 1: Defining the Scope and Responsibilities
Every robust process model begins with structure. We cannot simply draw lines; we must define the boundaries of the process and the roles involved. In BPMN, this is achieved using Pools and Lanes.
- The Pool: Think of the pool as the container or the “system” boundary. In our example, the Pool is labeled “Expense Approval Process”. It encapsulates everything happening within the scope of this specific workflow.
- The Lanes: Inside the pool, we divide the process into horizontal lanes to assign responsibility. This visualizes the “Swimlane” concept. For our diagram, we have established three distinct actors:
- Employee Lane: The initiator of the process.
- Manager Lane: The approver and decision-maker.
- Finance Department Lane: The final executor of the payment.
Step 2: Initiating the Workflow
A process needs a trigger. In BPMN, this is represented by an Event. We start our diagram in the Employee lane with a Start Event (a thin circle).
For this workflow, the trigger is the submission of a claim. We label this event “Expense Report Submitted”. This symbol tells the system: “The process begins here, once this condition is met.”
Step 3: Modeling the Activities
Once the process starts, the work begins. These work items are called Tasks, represented by rounded rectangles. We move through the lanes sequentially:
- Employee Task: The first logical step is for the employee to “Fill Out Expense Form”. This is a specific, actionable task performed within the employee’s lane.
- Manager Task: The process flows upward to the Manager lane. Here, the task is to “Review Expenses”. The manager verifies the data and checks for policy compliance.
- Finance Task: Finally, the workflow reaches the Finance Department to “Process Payment”. This is the culmination of the process.
Step 4: Handling Logic and Decisions
Real-world processes are rarely linear; they often involve branching logic based on conditions. In our diagram, the Manager cannot simply approve everything. There must be a decision point.
This is modeled using a Exclusive Gateway (a diamond shape with an ‘X’ inside). This symbol indicates that the path taken depends on a specific condition—in this case, a binary decision: “Approved?”
This gateway splits the flow into two distinct paths:
- Path A (Approved): If the manager approves, the flow continues downwards to the Finance lane to process the payment.
- Path B (Rejected): If the manager rejects the claim, the flow moves horizontally to the right and loops back to the Employee lane, signaling that the request is denied or requires resubmission.
Step 5: Concluding the Process
Every process must have a clear conclusion. We use End Events (thick circles) to mark the termination of the flow. Our diagram has two possible outcomes, meaning we need two end events:
- Success State: In the Finance lane, we place an end event labeled “Payment Completed”. This signifies a successful workflow execution.
- Failure State: In the Employee lane, we place an end event labeled “Request Denied”. This is crucial for tracking process efficiency and understanding why processes are being stopped.
Step 6: Connecting the Dots
The final architectural step is to connect all these elements using Sequence Flows (solid arrows). These arrows define the order of execution. They guide the reader from the Start Event, through the tasks and the decision gateway, and finally to the appropriate End Event.
By following this structured approach, we have transformed a simple concept into a robust, executable business model. This diagram not only documents the current state but also provides a blueprint for automation and optimization.