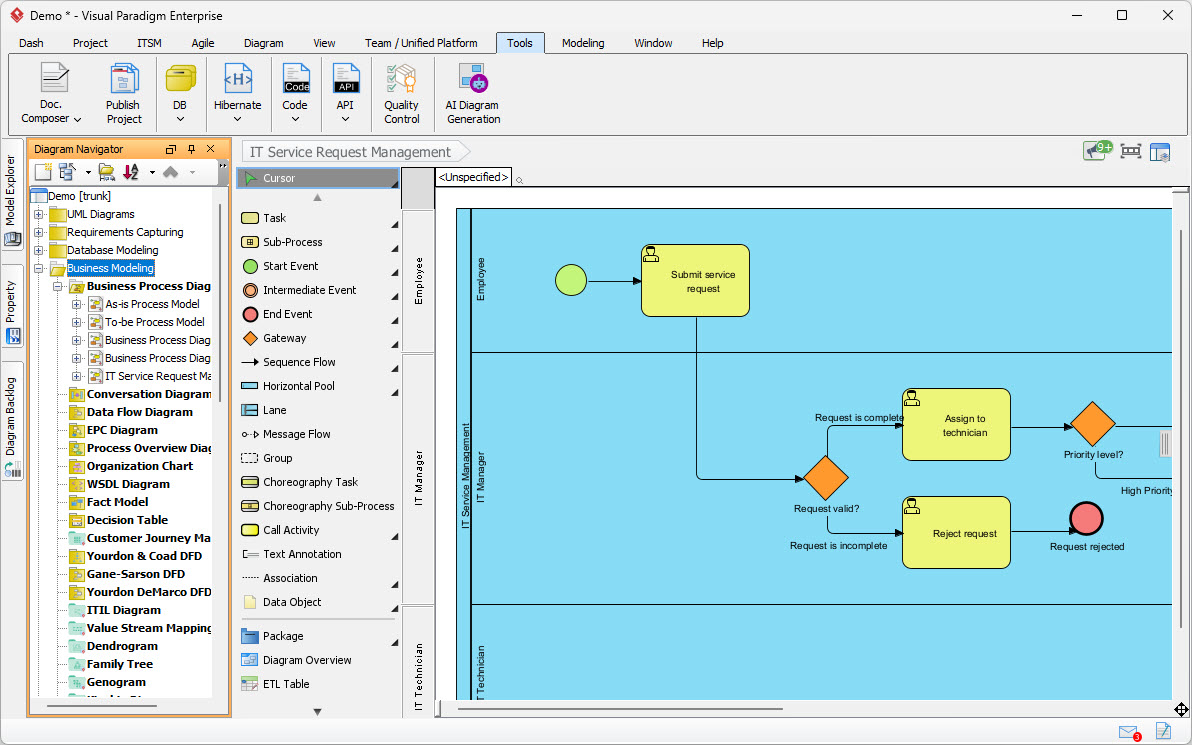
In the world of enterprise architecture and business analysis, clarity is currency. The image provided showcases a classic example of Business Process Model and Notation (BPMN) created within the Visual Paradigm Desktop environment. This tutorial will deconstruct the diagram shown—specifically an IT Service Request Management workflow—teaching you how to read, interpret, and understand the architectural logic behind it.
Understanding the Anatomy of a BPMN Diagram
The screenshot displays a “Swimlane” diagram, a specific type of flowchart used to visualize the flow of activities within a process. The horizontal bars dividing the blue background are called swimlanes. Each lane represents a specific role, department, or actor responsible for the tasks within that horizontal strip.
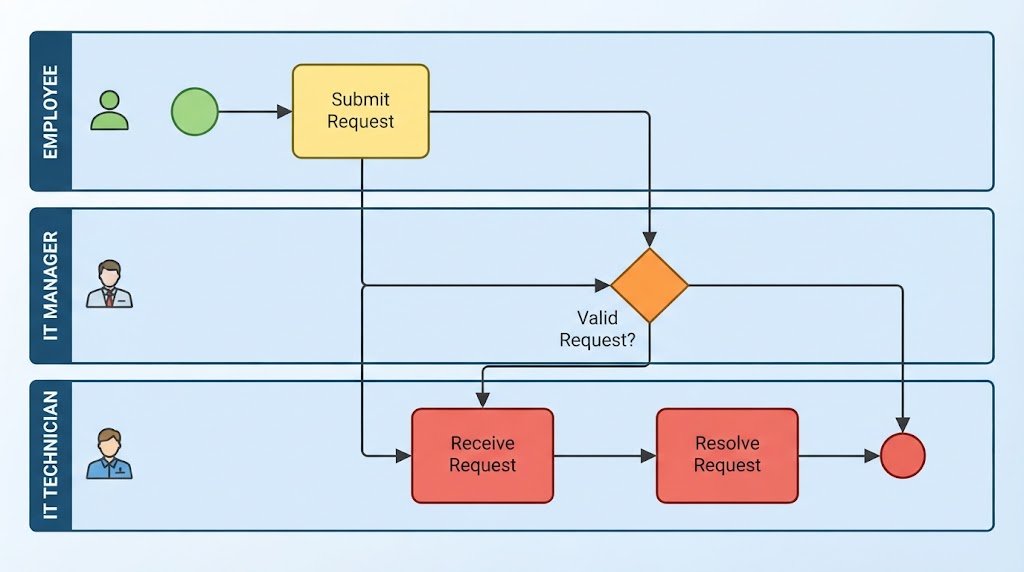
In this specific model, we see three distinct lanes:
- Employee: The initiator of the process (the user needing IT help).
- IT Services Management (IT Manager): The decision-maker and coordinator.
- IT Technician: The executor who resolves the technical issue.
Step-by-Step Process Flow Analysis
Let us walk through the logic of the diagram from left to right, following the standard BPMN symbols.
1. The Initiation (Start Event)
The process begins on the far left with a green circle. In BPMN terminology, this is a Start Event. It signifies the moment the “Employee” decides to initiate a service request. There are no preceding steps; this is the trigger for the entire workflow.
2. The Action (Task)
Following the arrow (Sequence Flow) leads to a yellow rounded rectangle labeled “Submit service request”. This is a Task. It represents a single unit of work performed by the Actor in that lane (the Employee). This could involve filling out a form, sending an email, or using a ticketing system.
3. The First Decision (Gateway)
The flow moves to the “IT Manager” lane and hits an orange diamond. This is a Exclusive Gateway (often called a decision point). It asks a binary question: “Request valid?”
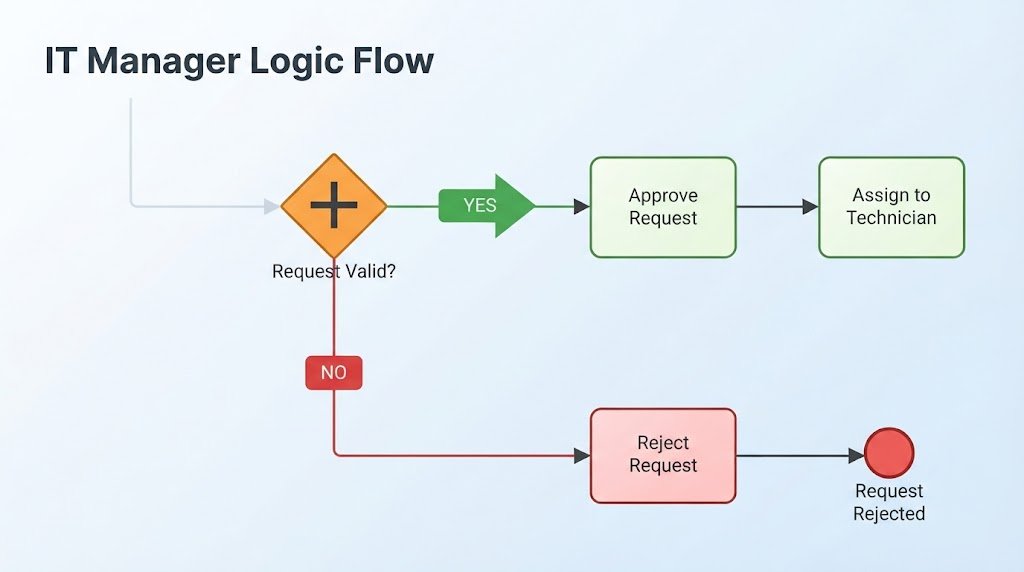
- Path A (No): If the request is incomplete or invalid, the flow follows the bottom arrow labeled “Request is incomplete” to the task “Reject request”, which then leads to a Red End Event (labeled “Request rejected”). The process terminates here.
- Path B (Yes): If the request is valid, the flow continues to the right.
4. The Assignment (Task)
On the “yes” path, the next task is “Assign to technician”. This is a critical handoff point. The Manager validates the request and formally assigns it to the technical team. This bridges the gap between the Management lane and the Technician lane.
5. The Second Decision (Gateway)
Immediately after assignment, the diagram shows another orange diamond in the IT Manager lane asking: “Priority level?”
This suggests a routing logic where the system or manager categorizes the urgency of the request (e.g., High Priority vs. Standard). While the diagram cuts off, this typically leads to different workflows: high-priority tickets might trigger immediate alerts, while standard ones go into a queue.
Key Modeling Concepts Illustrated
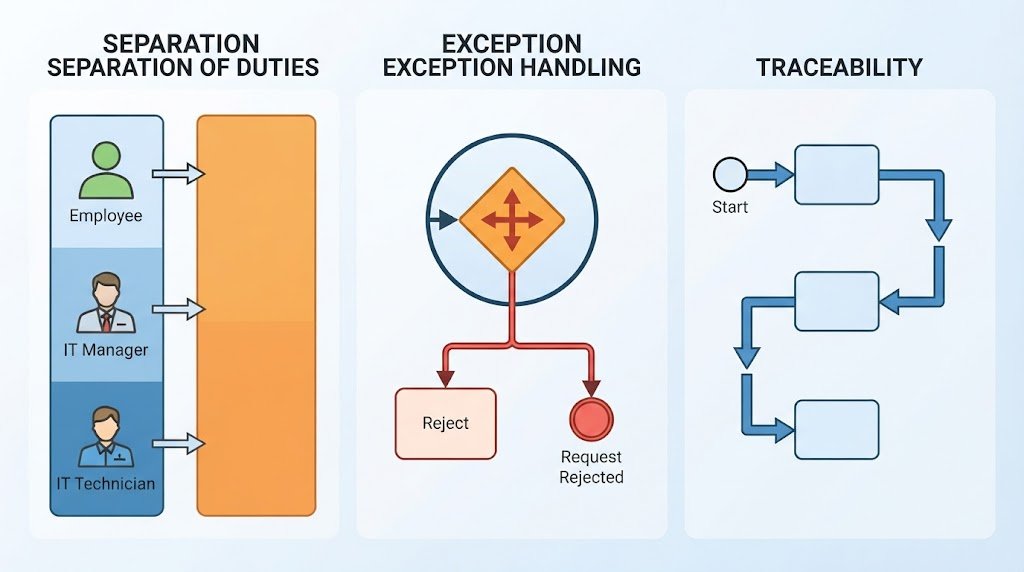
For students and professionals learning system architecture, this diagram illustrates three vital concepts:
- Separation of Duties: The swimlanes clearly demarcate who does what. The Employee requests, the Manager validates, and the Technician solves. This prevents role confusion.
- Exception Handling: Notice the path for “Request is incomplete.” A robust system architecture must account for errors or invalid inputs. This diagram explicitly models what happens when a request fails validation, rather than assuming success.
- Traceability: The arrows (Sequence Flows) provide a clear audit trail. If a process bottleneck occurs, you can trace exactly where the flow is stalling.
Leveraging Modern Tools for Modeling
As seen in the top toolbar of the screenshot, modern modeling tools like Visual Paradigm now integrate AI Diagram Generation. This represents a shift in how we build these models:
- Traditional Method: Dragging and dropping shapes from the palette (visible on the left) to build the model manually.
- AI-Assisted Method: Describing the process in plain English, allowing the AI to generate the draft diagram (as hinted at in the “AI Diagram Generation” tab).
Regardless of the method, the resulting BPMN diagram remains the “single source of truth” for the business logic, bridging the gap between business requirements and IT implementation.