In the realm of industrial engineering and systems architecture, the gap between a current operational state and a desired future state is where value is created. This tutorial dissects the XYZ Manufacturing Process Improvement Journey, using it as a case study to explain how organizations architect their transition from inefficient legacy processes to optimized, technology-driven workflows.
We will break down the technical architecture of this transformation, analyzing the specific “As-Is” (Before) and “To-Be” (After) system models, and examining the implementation strategies that bridge the gap.
1. Conceptual Framework: The As-Is vs. To-Be Model
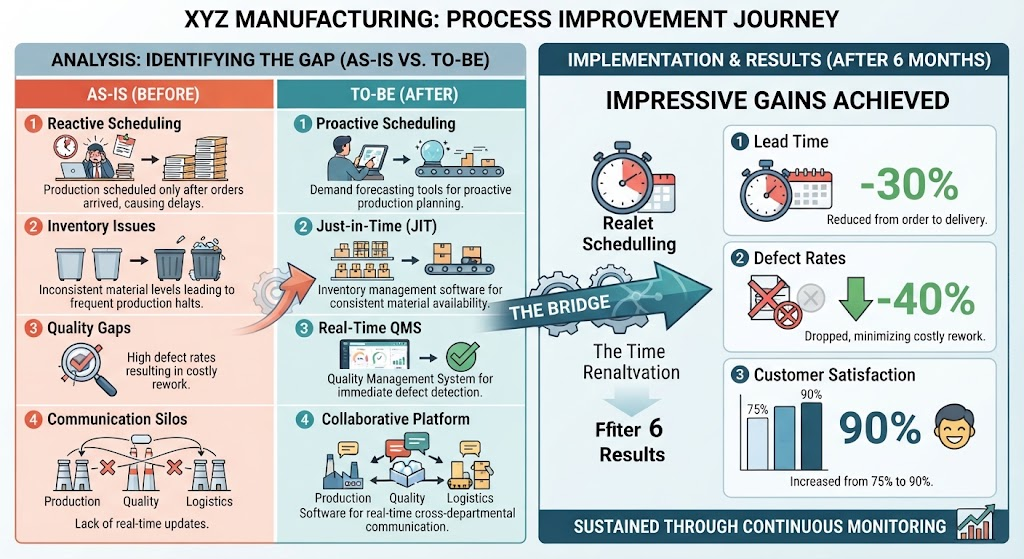
Before diving into the specific metrics, it is essential to understand the modeling concept at play. This diagram represents a Gap Analysis, a standard technique used in Business Process Reengineering (BPR). It maps the current reality (As-Is) against the target state (To-Be).
The “As-Is” System (Legacy Architecture)
The left side of the diagram represents the As-Is state. In systems terms, this is a reactive environment characterized by latency and siloed data. The four pillars of this legacy system were:
- Reactive Scheduling: A pull-based system triggered only after orders arrived. This introduces a critical path delay (latency) between customer demand and production initiation.
- Inventory Issues (JIT Failure): The absence of real-time data resulted in inconsistent material levels. This is a classic supply chain bottleneck leading to production halts.
- Quality Gaps: The detection of defects was likely post-production or periodic, leading to costly rework. This represents a “lagging indicator” quality system.
- Communication Silos: The diagram shows distinct departments (Production, Quality, Logistics) operating without real-time synchronization. This lack of interoperability is a structural flaw in the organizational architecture.
The “To-Be” System (Target Architecture)
The middle column represents the To-Be state. This is a proactive, integrated system architecture designed for efficiency. The architectural shifts include:
- Proactive Scheduling: The system shifts from reactive to predictive. By implementing demand forecasting tools, the system anticipates production needs before orders are placed, effectively reducing latency.
- Just-in-Time (JIT) Inventory: The adoption of inventory management software ensures material availability. This creates a synchronized flow where materials arrive exactly when needed, minimizing waste.
- Real-Time QMS: The introduction of a Quality Management System (QMS) enables immediate defect detection. This moves quality control to the “point of creation,” preventing the propagation of defects.
- Collaborative Platform: A unified software layer is deployed to facilitate cross-departmental communication, breaking down silos and ensuring data consistency across Production, Quality, and Logistics.
2. The Implementation Bridge: Architecture & Change Management
The diagram visualizes the transition with a large arrow labeled “The Bridge,” which the image text refers to as The Time Realvation (likely a stylistic term for Time Revolution or Realization). This is not merely a software update; it is a systemic overhaul.
In a technical implementation context, this phase involves:
- Phased Rollout: As noted in the supplementary text, XYZ Manufacturing phased in changes over six months. This minimizes disruption to the legacy system.
- Targeted Training: The introduction of new tools requires a shift in human workflow. The training ensures that operators can effectively utilize the new demand forecasting and QMS tools.
- Data Integration: The “Collaborative Platform” implies an integration of data streams. For example, the Quality system must now feed data back to the Scheduling system instantly.
3. Quantitative Analysis: Measuring System Performance
The right side of the diagram presents the Implementation & Results phase. In systems analysis, we measure success through Key Performance Indicators (KPIs). The XYZ case study provides a clear before-and-after comparison:
A. Lead Time Reduction (-30%)
Definition: The total time from order receipt to delivery.
Analysis: By moving from reactive to proactive scheduling, the manufacturing process eliminated idle time. The 30% reduction indicates a significant optimization of the critical path in the production lifecycle.
B. Defect Rate Reduction (-40%)
Definition: The percentage of products that fail quality standards.
Analysis: The implementation of the Real-Time QMS was the driving factor here. By catching defects immediately, the system prevented the “cost of poor quality” (rework and scrap) from accumulating.
C. Customer Satisfaction Improvement (75% to 90%)
Definition: The metric reflecting the customer’s perception of the service and product.
Analysis: This is the ultimate output metric. The reduction in lead time (faster delivery) and the reduction in defects (better product) directly correlate to the 15 percentage point increase in customer satisfaction.
4. Sustainability: The Feedback Loop
The bottom of the diagram emphasizes “Sustained Through Continuous Monitoring.” In systems engineering, a change is not complete until it is stabilized. XYZ Manufacturing established a monitoring protocol to ensure that the new architecture does not regress to the old “As-Is” state. This involves:
- Continuous Data Collection: Using the new software to track KPIs in real-time.
- Iterative Improvement: Using the data to fine-tune the demand forecasting algorithms and inventory thresholds.
Conclusion
The XYZ Manufacturing journey serves as a textbook example of how structured As-Is and To-Be analysis drives tangible business value. By identifying specific architectural flaws in scheduling, inventory, quality, and communication, and replacing them with integrated, real-time solutions, the organization achieved a 30% reduction in lead time and a 40% drop in defects.
For engineers and business analysts, this diagram illustrates that the path to efficiency lies not in working harder, but in redesigning the system to be proactive, integrated, and data-driven.