


Welcome to this deep dive into Visual Paradigm Enterprise, a robust modeling tool designed to streamline the software development lifecycle. The screenshot provided showcases the Community Circle interface, a centralized hub where users can select the appropriate modeling methodology for their project needs. Whether you are defining data structures, mapping business workflows, or brainstorming project scope, this platform supports a wide array of diagram types.
In this tutorial, we will break down the three primary modeling categories visible in the interface: UML Diagrams, BPMN Diagrams, and Mind Map Diagrams. By the end, you will understand how these distinct visual languages serve different but complementary roles in system architecture.
1. UML Diagrams: The Architect’s Blueprint
The first section of the dashboard highlights UML (Unified Modeling Language). UML is the industry-standard language for specifying, constructing, and documenting the artifacts of software systems. The screenshot specifically displays a Class Diagram, which is fundamental for object-oriented design.
Understanding the Class Diagram
In the image, we see a static structure diagram defining the “skeleton” of the application. Let’s analyze the visible components:
- Classes: The blue boxes represent classes such as
Customer,Order, andPayment. - Attributes: Inside these boxes, you can see data types and properties. For example, the
Customerclass holds aStringfor Address and abooleanfor status. TheOrderclass has adateattribute forcreateDate. - Relationships: The lines connecting the boxes represent relationships. The number 1 near the
Customerand 0..* (zero to many) near theOrderindicates that one customer can place multiple orders, but an order is typically associated with a single customer.
As the text in the image suggests, UML is incredibly versatile. Beyond Class Diagrams, Visual Paradigm supports 13 other types, including:
- Use Case Diagrams: To map out user interactions.
- Sequence Diagrams: To visualize the order of operations over time.
- State Machine Diagrams: To show the lifecycle of an object.
2. BPMN Diagrams: Mapping Business Workflows
The middle section introduces BPMN (Business Process Model and Notation). While UML focuses on the internal software structure, BPMN is designed to visualize business processes and workflows. It acts as a bridge between business analysts and technical developers.
Analyzing the Swimlane Diagram
The screenshot shows a classic Swimlane Diagram, which organizes activities by the actor responsible for them. Notice the horizontal lanes labeled Customer and Server Service Assistant.
- Start Event: The process begins with a green circle, indicating the initiation of an action.
- Task Execution: The yellow rounded rectangle
Place Orderis a task performed by the Customer. - Sequence Flow: The solid arrow indicates the direction of the process flow.
- Verification: The dashed line crossing into the Server Service Assistant lane leads to the task
Verify Customer Identity. This visualizes handoffs between different departments or roles. - Gateway: The orange diamond shape represents a decision point. The process splits here based on the outcome of the verification (e.g., “Over 90 by phone” vs. other outcomes).
This type of modeling is crucial for stakeholders because it allows non-technical users to understand the “why” and “how” of a business process without getting bogged down in code.
3. Mind Map Diagrams: Structuring Ideas
The final section showcases Mind Map Diagrams. Before diving into technical diagrams or complex workflows, projects often begin with a brainstorming phase. Mind maps are the ideal tool for this stage.
Organizing Project Scope
The image displays a hierarchical structure radiating from a central node labeled Project. This visual representation helps in:
- Idea Generation: Quickly capturing thoughts without linear constraints.
- Scope Definition: The branch labeled
Scopesplits into “What is included” and “What is excluded”. This is vital for preventing scope creep in software projects. - Goal Setting: The
Aimsbranch connects to “Measurement to achieve” and “Critical success factors”, helping teams define what “done” looks like.
Conclusion
Visual Paradigm’s interface, as seen in the screenshot, demonstrates a holistic approach to system design. By integrating UML for technical architecture, BPMN for business logic, and Mind Maps for strategic planning, developers and analysts can ensure that every aspect of a project—from high-level goals to low-level data attributes—is clearly defined and understood.
Related posts:
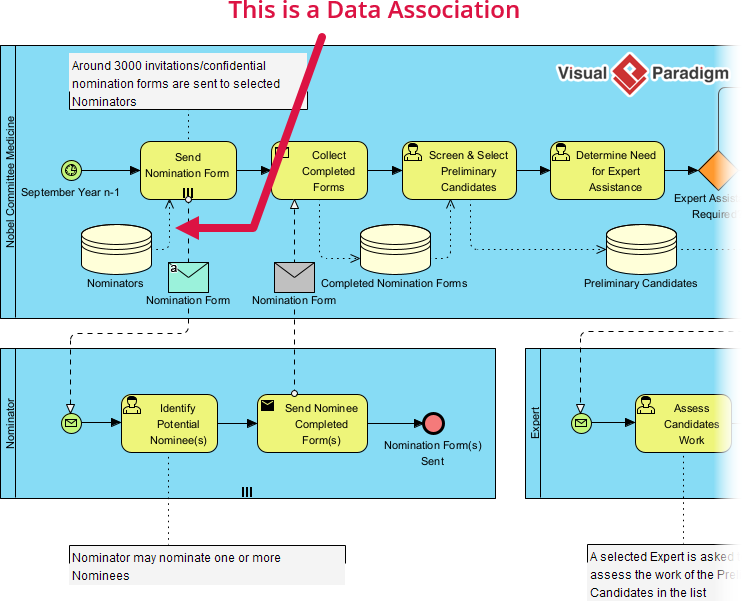 Mastering Data Association in BPMN Diagrams: A Visual Guide
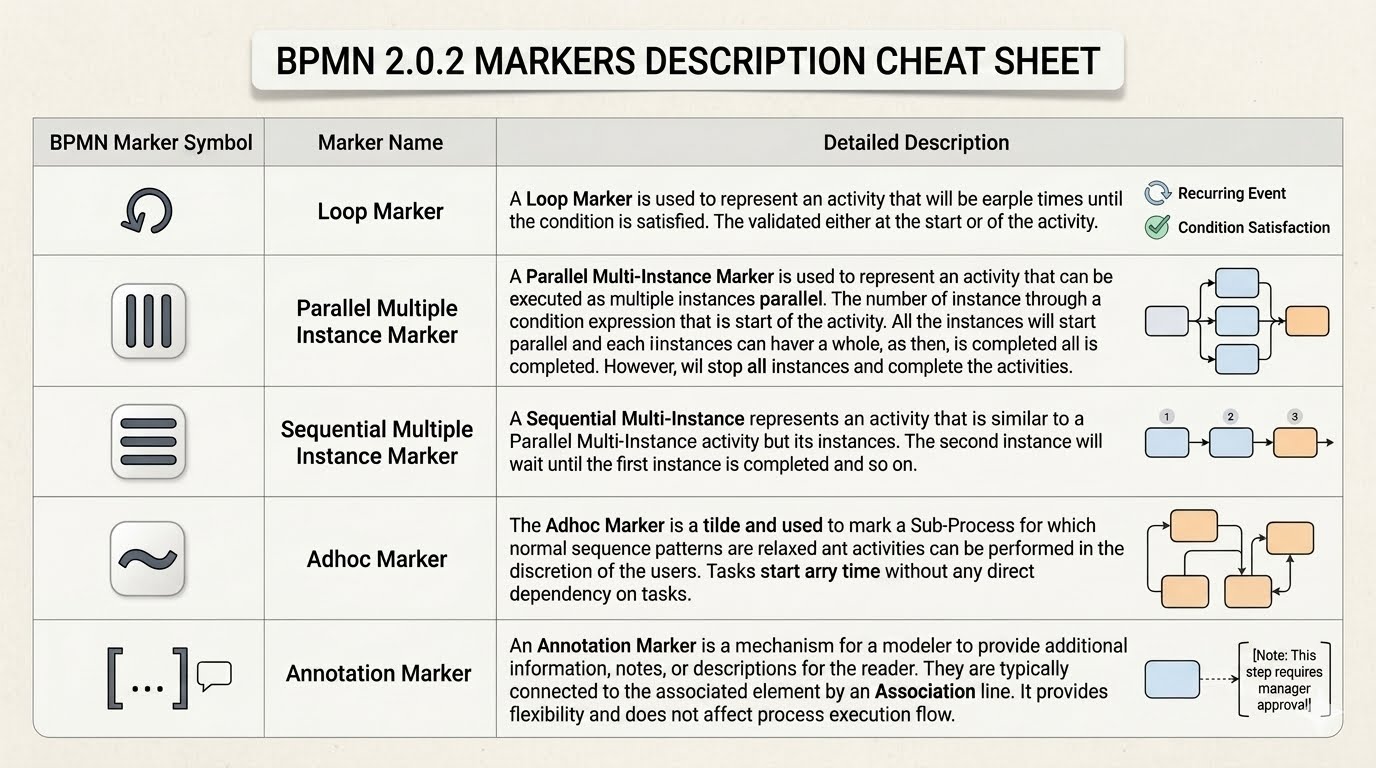 Mastering BPMN 2.0 Markers: The Hidden Modifiers That Control Process Execution
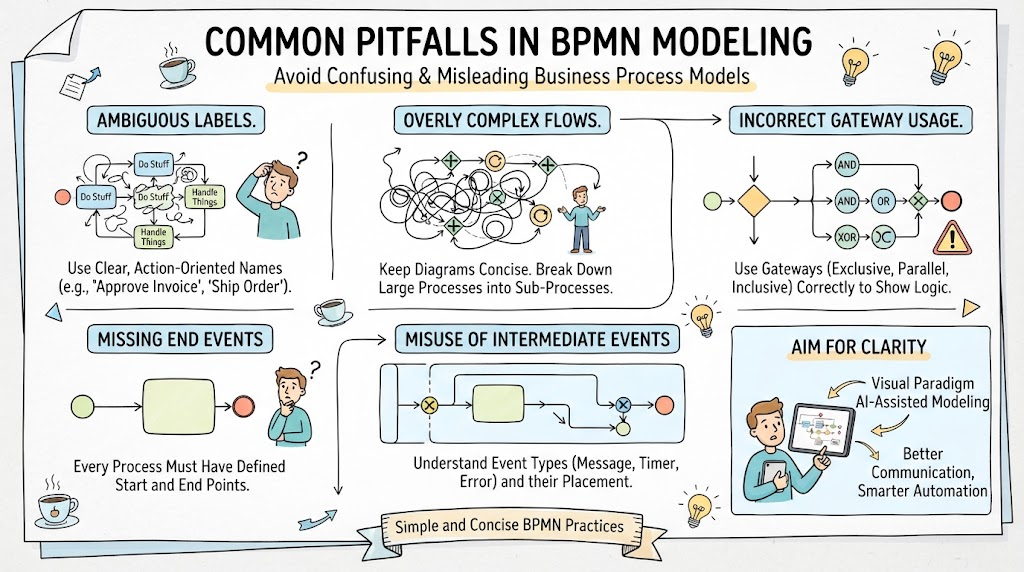 Mastering BPMN: A Guide to Avoiding Common Modeling Pitfalls
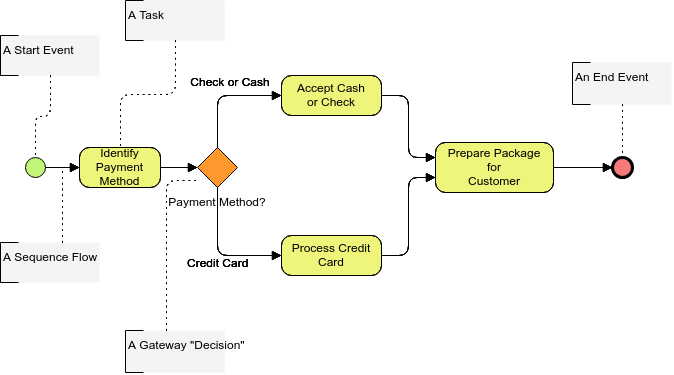 Mastering BPMN Basics: A Step-by-Step Guide to Process Modeling with Start Events, Gateways, and Tasks