Welcome to Your UML Masterclass
Imagine you are an architect building a skyscraper. Before laying a single brick, you need blueprints, electrical schematics, and structural load calculations. In software engineering, the Unified Modeling Language (UML) serves as this universal blueprint system. As we embark on this tutorial, we will navigate the complete ecosystem of the 14 standard UML diagram types. These tools are not just abstract boxes and arrows; they are the critical thinking instruments that allow us to visualize, specify, construct, and document software systems effectively.
The Two Pillars of Modeling: Structural vs. Behavioral
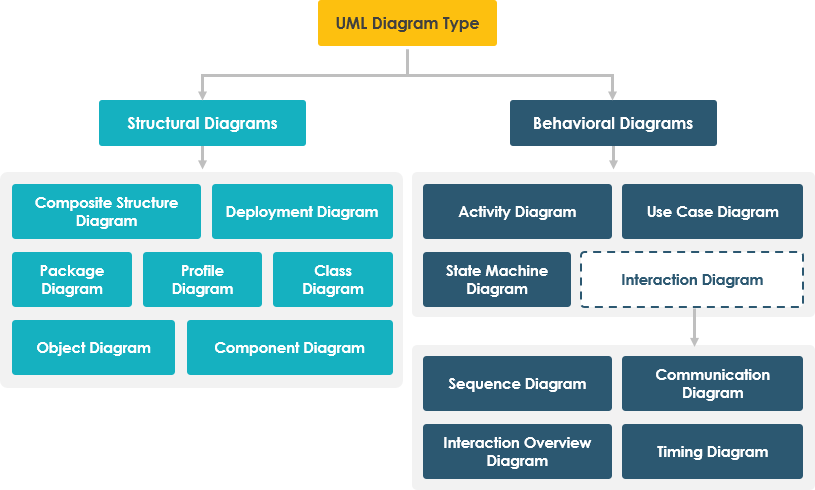
To make sense of the vast array of diagrams available to us, we first need to categorize them. As you can see in our foundational chart, UML diagrams are broadly split into two main families: Structural Diagrams and Behavioral Diagrams. This distinction is vital. Structural diagrams focus on the static aspects of a system—its anatomy, its parts, and how they relate to one another. Behavioral diagrams, on the other hand, focus on the dynamic aspects—how the system moves, reacts, and interacts over time.
Part 1: Structural Diagrams (The Anatomy of a System)
Let’s begin with the structural side of the equation. These diagrams provide the skeleton of your software architecture.
The Core: Class and Object Diagrams
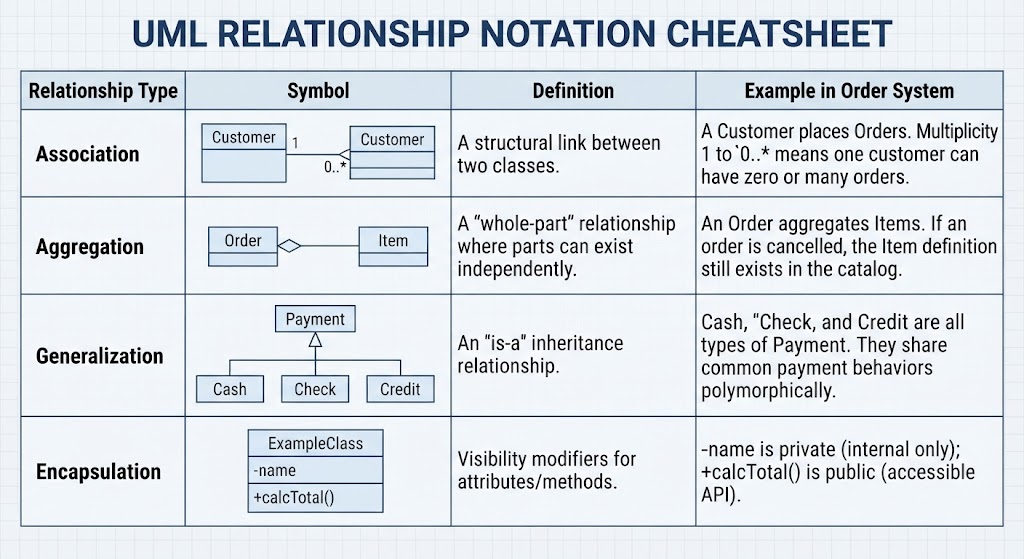
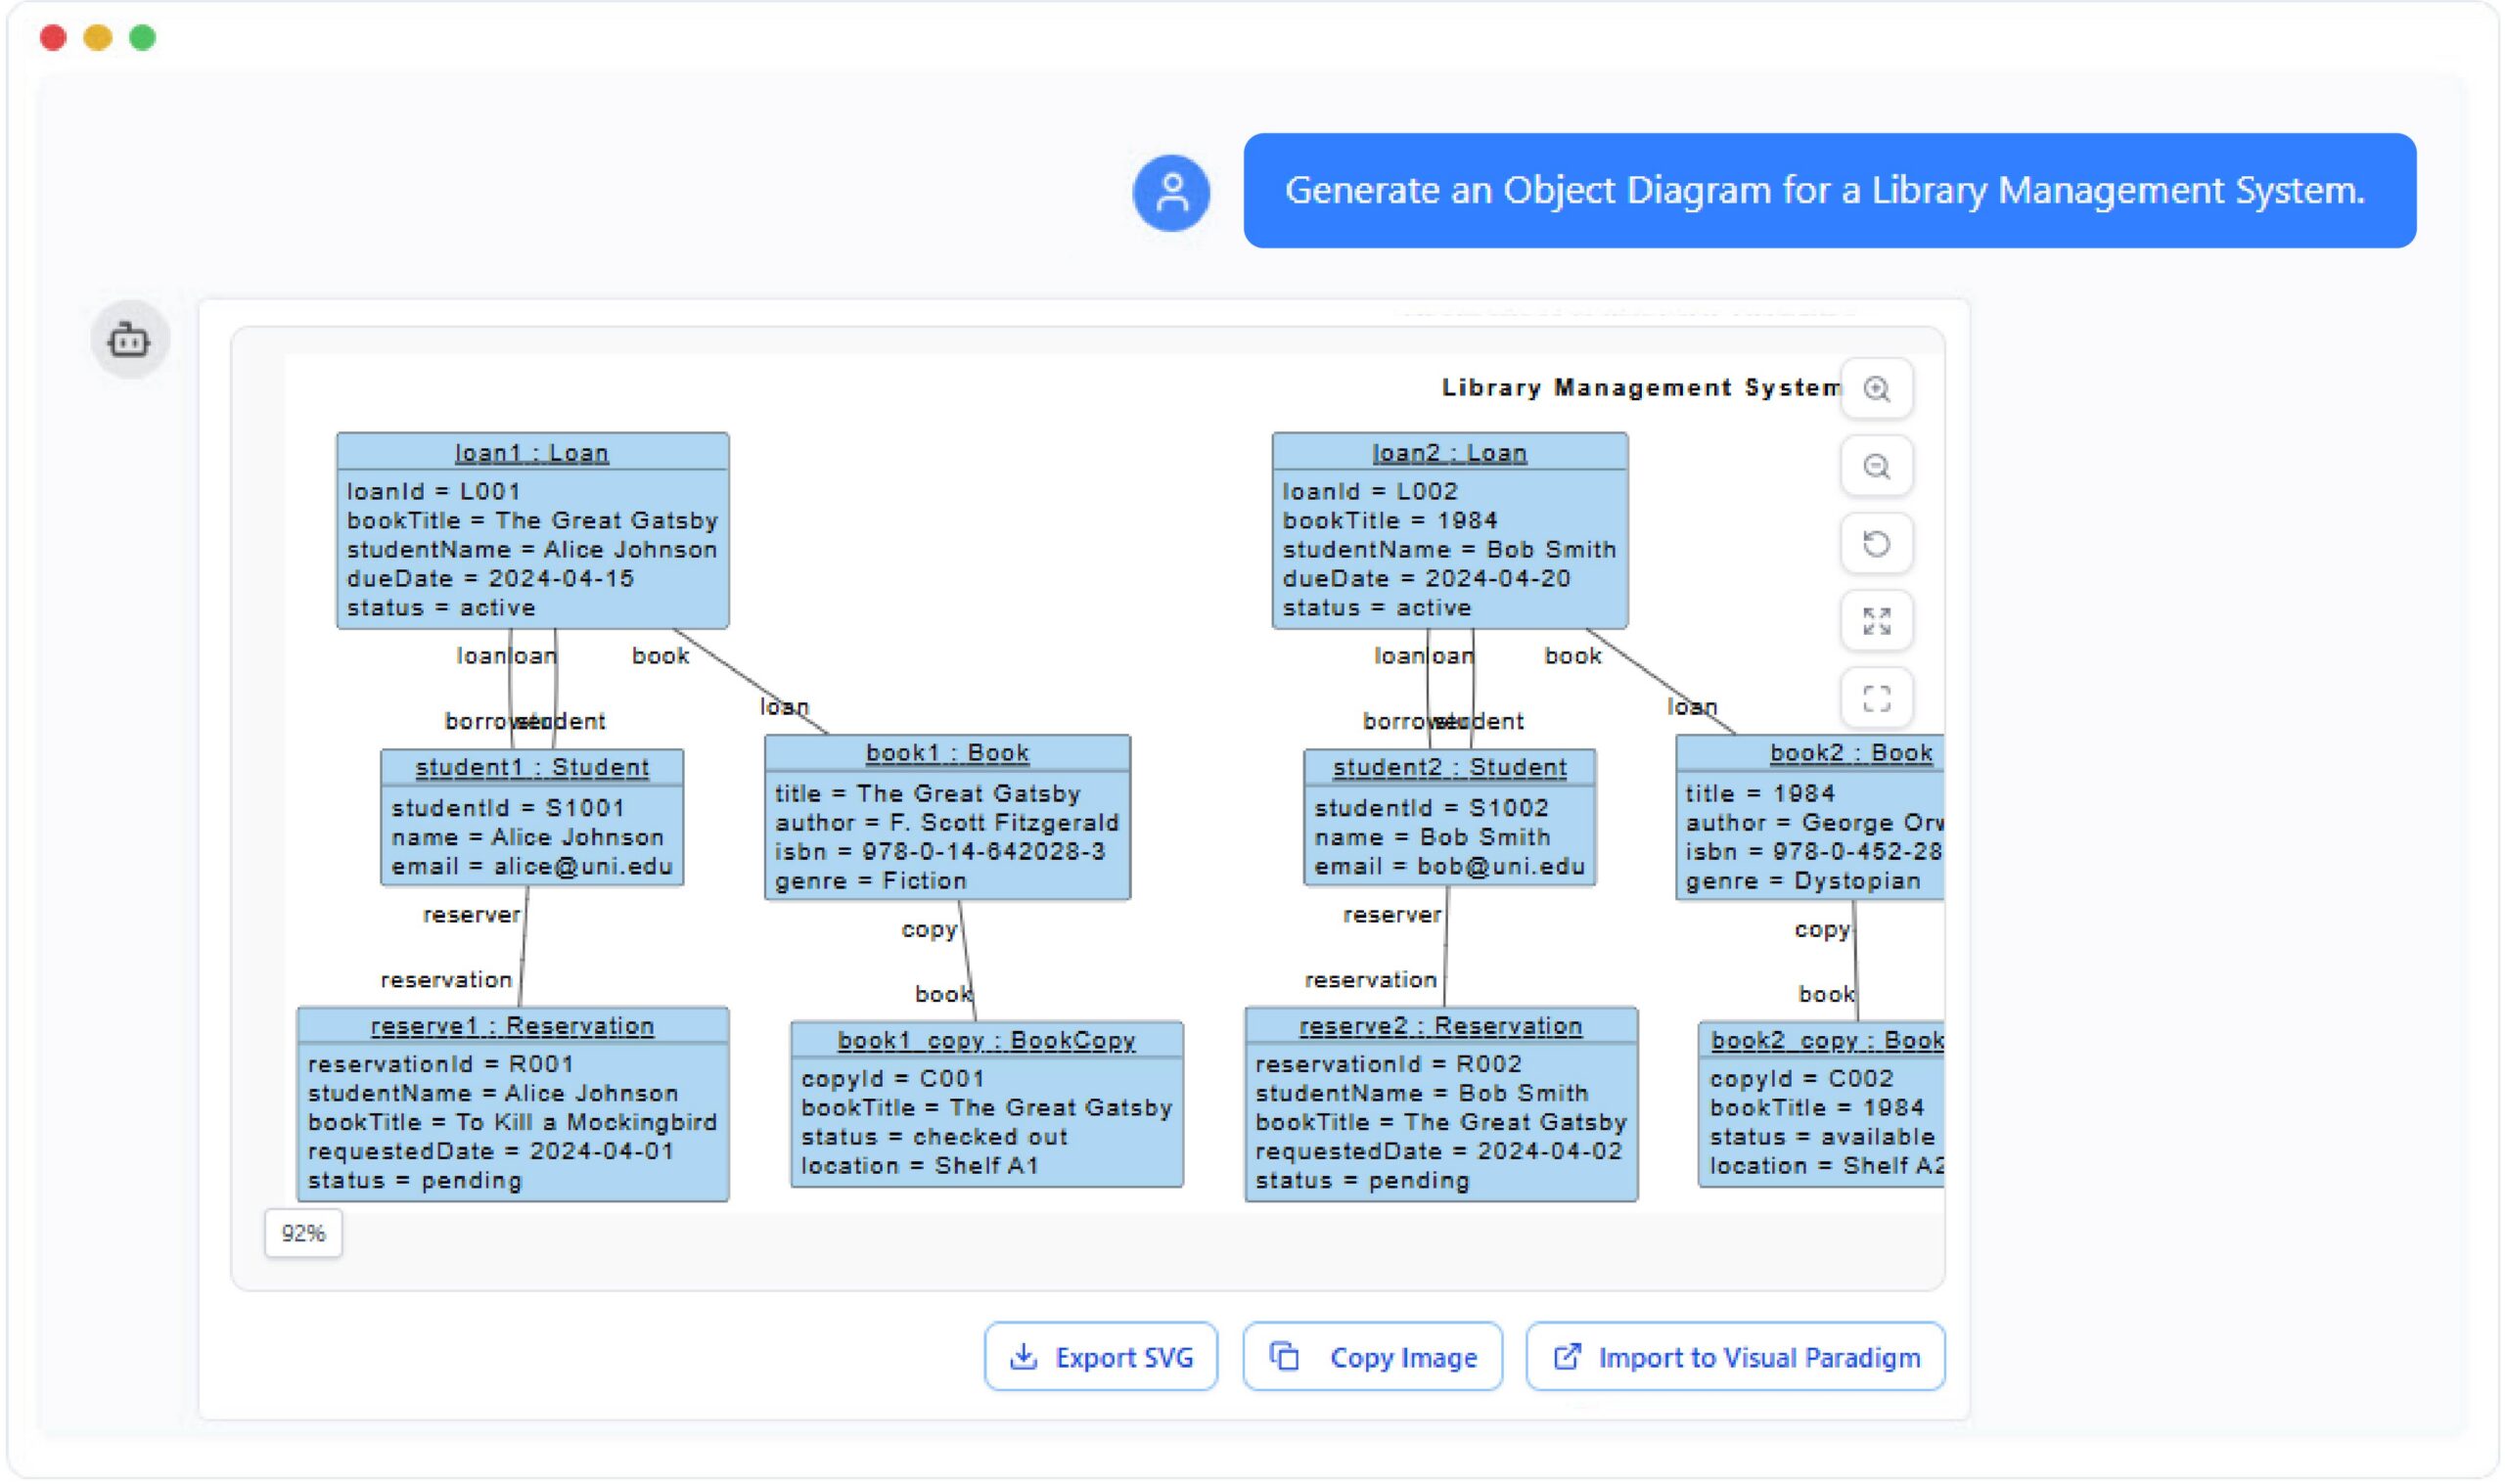
At the heart of almost every object-oriented design is the Class Diagram. In our previous sessions, we discussed how Class Diagrams are indispensable for API design. They define the blueprint of your system’s classes, their attributes, operations, and the relationships between them. If the Class Diagram is the blueprint, the Object Diagram is the snapshot. It represents a specific state of the system at a particular moment in time, showing actual instances of classes.
Organizing the Complexity: Package, Profile, and Composite Structure
As systems grow, they become messy. This is where the Package Diagram comes in to organize classes and components into logical groups. For more advanced needs, the Profile Diagram allows you to extend UML to create custom stereotypes for specific domains, while the Composite Structure Diagram dives deeper into the internal architecture of a single class or component.
The Infrastructure: Component and Deployment Diagrams
Once your code is designed, you need to know how it runs. The Component Diagram models the physical components of the system, such as libraries or executables. Finally, the Deployment Diagram visualizes the hardware topology—where software components are actually deployed on servers, networks, and devices.
Part 2: Behavioral Diagrams (The Life of a System)
Now that we have the skeleton, let’s add the muscle and nervous system. Behavioral diagrams describe how the system behaves and interacts.
Requirements and Workflows: Use Case and Activity Diagrams
Before writing code, we must understand the user’s needs. The Use Case Diagram captures these requirements, showing the interactions between actors (users) and the system. Once the requirements are clear, the Activity Diagram helps us model the workflow. Think of this as a flowchart for complex logic, detailing the sequence of actions from start to finish.
Lifecycles and Interactions
Some objects have complex lives. For these scenarios, we use the State Machine Diagram. As mentioned in our context, these are perfect for modeling complex object lifecycles, showing how an object transitions between states (like an Order moving from “Placed” to “Shipped” to “Delivered”).
The Art of Communication: Interaction Diagrams
Perhaps the most critical aspect of software is how parts talk to each other. The Interaction Diagram is a category that encompasses four distinct diagram types:
- Sequence Diagram: This is often the go-to for interaction logic. It arranges messages vertically over time, showing exactly which object sends a message to which other object and when.
- Communication Diagram: Similar to the sequence diagram but focuses on the structural organization of objects rather than the strict timeline.
- Interaction Overview Diagram: A high-level flowchart that combines activity diagrams and sequence diagrams.
- Timing Diagram: This specialized diagram focuses strictly on the timing constraints and changes in state over time.
Conclusion: Choosing the Right Tool
You now have a map of all 14 standard UML diagram types. Whether you are designing a robust API, visualizing a complex state machine, or mapping out a sequence of user interactions, there is a specific diagram designed to help you clarify your thoughts. By mastering these tools, you move from simply writing code to truly engineering solutions.