In the world of software architecture, clarity is king. When explaining complex systems like a banking platform to stakeholders, developers, or new team members, a wall of code is rarely the answer. Instead, we use diagrams. One of the most effective tools for this is the C4 Model. In this tutorial, we will dissect a specific C4 Context Diagram (often called a Level 1 diagram) for a fictional entity, “Big Bank Plc,” to understand how to visualize high-level system architecture.
What is the C4 Model?
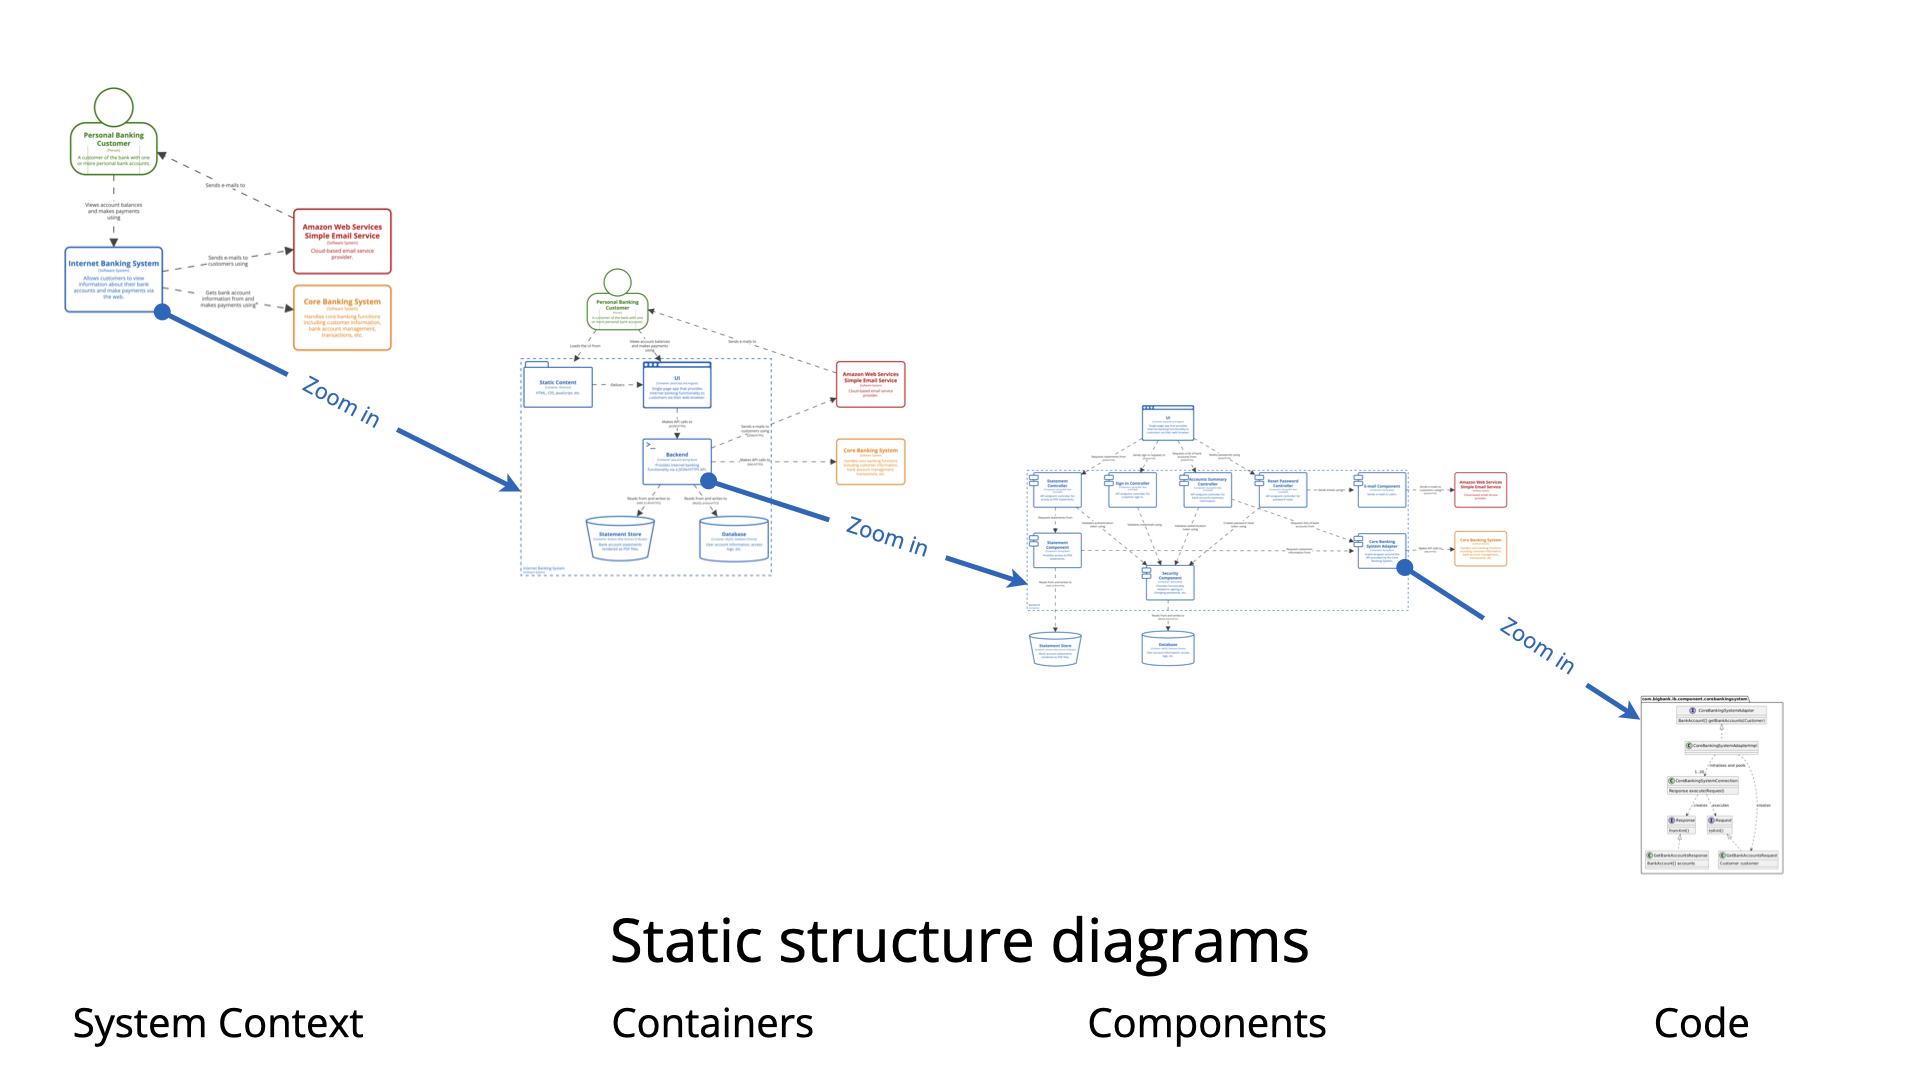
The C4 model is a hierarchical approach to visualizing software architecture. It consists of four levels, each providing a different level of detail:
- Level 1: System Context Diagram: The “big picture.” It shows the software system as a single box and how people interact with it.
- Level 2: Container Diagram: Breaks down the system into containers (e.g., web apps, mobile apps, databases).
- Level 3: Component Diagram: Details the internal components of a container.
- Level 4: Code Diagram: Shows the actual code structure.
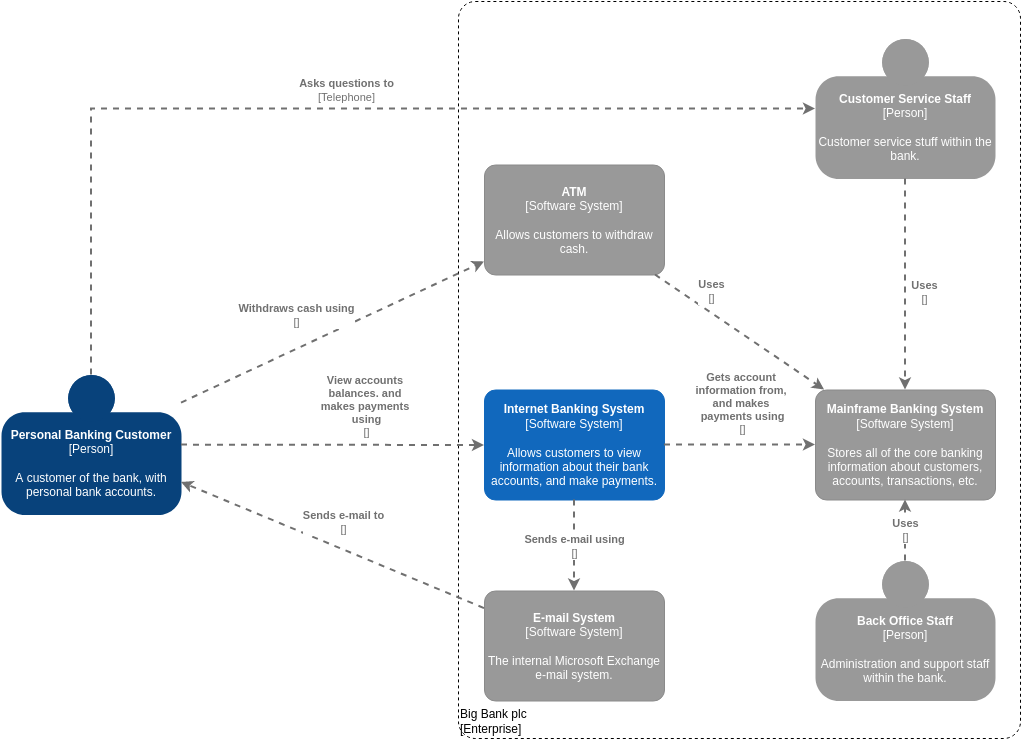
The image provided is a Level 1 System Context Diagram. It is the most abstract view, designed to answer the question: “What does this system do, and who uses it?”
Deconstructing the “Big Bank Plc” Context Diagram
Let’s break down the visual elements of this diagram to understand the architecture of this banking system.
1. The Enterprise Boundary
Notice the large dotted box encompassing most of the diagram. At the bottom left, it is labeled Big Bank plc [Enterprise Boundary]. This is a crucial concept in the C4 model. It defines the scope of the software we are discussing. Anything outside this box is external to our immediate system scope, while anything inside is part of the “Big Bank” ecosystem.
2. The Actors: People and Systems
The diagram uses standard shapes to represent different entities. In the C4 model, these are strictly categorized:
- Person (The Blue Circle): On the far left, we see the Personal Banking Customer. This is the primary external actor. They are “outside” the enterprise boundary but interact directly with the system.
- Software System (The Grey/Blue Boxes): These represent the applications or services.
- Internet Banking System: The core software allowing customers to view accounts.
- ATM: A specialized software system controlling the hardware.
- Mainframe Banking System: The backend “brain” that stores all core data.
- E-mail System: A supporting system used for communication.
- Internal People: Note the people on the right side (Customer Service Staff, Back Office Staff). Unlike the customer on the left, these people are inside the Enterprise Boundary because they work for the bank.
3. The Relationships: How Things Connect
The lines connecting these boxes are just as important as the boxes themselves. They represent data flow or usage. In a Context Diagram, we focus on the verbs.
The Customer’s Journey
Let’s trace the interactions for the Personal Banking Customer:
- Viewing Accounts: The customer uses the
Internet Banking Systemto “View accounts balances, and make payments using” it. This establishes the primary interface for the user. - Withdrawing Cash: The customer interacts with the
ATMto “Withdraw cash using” it. This shows that the ATM is a valid entry point for the system. - Support: The customer “Asks questions to” the
Customer Service Staffvia telephone. This indicates a human-in-the-loop support channel.
The Internal Data Flow
Now, look at how the systems talk to each other inside the boundary. This reveals the architecture:
- The Backend Core: Notice that the
Internet Banking System, theATM, and theMainframe Banking Systemare all connected. The text says the Internet Banking system “Gets account information from, and makes payments using” the Mainframe. This tells us the Mainframe is the single source of truth for all data. - Communication: The
Internet Banking System“Sends e-mail using” theE-mail System. This is a common architectural pattern where a core application delegates communication tasks to a dedicated service (like an SMTP server or Exchange server). - Staff Access: Both the
Customer Service StaffandBack Office Staff“Uses” theMainframe Banking System. This implies that internal employees have direct access to the core data to perform administration and support tasks.
Why This Diagram Works
This specific diagram is an excellent example of a well-documented architecture for several reasons:
- It defines boundaries clearly: We immediately know what is “Big Bank Plc” and what is external.
- It avoids clutter: It doesn’t show tables, classes, or code. It focuses on high-level interactions.
- It uses descriptive labels: The text under the boxes (e.g., “Allows customers to view information…”) provides immediate context without needing a separate legend.
- It distinguishes internal vs. external: By placing the staff inside the dotted line and the customer outside, it visually communicates the scope of the software development project versus the business operations.
Conclusion
Understanding the C4 Context Diagram is the first step in mastering software architecture visualization. By breaking down the “Big Bank Plc” example, we see how a complex banking ecosystem can be reduced to a simple map of people, systems, and their relationships. Whether you are using Visual Paradigm, Draw.io, or another tool, the goal remains the same: to create a diagram that tells the story of your software at a glance.