


When designing complex software systems, one of the most critical challenges is communicating how the system behaves. While data flow diagrams might show how information moves across an organization, they often fail to capture the precise logic, conditional branching, and concurrency within a specific service. This is where the UML Activity Diagram shines.
As a technical tutor, I often find that developers and architects struggle to distinguish between a high-level business process and a specific system algorithm. This tutorial breaks down the core concepts of UML Activity Diagrams, demonstrating how to model workflows that involve parallel processing, conditional decisions, and event publishing using the Visual Paradigm toolset.
The Core Purpose: System Behavior vs. Business Operations
The primary distinction of a UML Activity Diagram is its scope. Unlike BPMN (Business Process Model and Notation), which might span an entire organization involving human actors and different departments, a UML Activity Diagram is typically bounded to a software system, service, or component.
Think of it this way: if the question is “Who approves the loan?”, that is a business process. If the question is “How does the software validate the request, check for fraud, and decide whether to return an error or publish an event?”, that is a system behavior best modeled with UML.
Key Use Cases
- Algorithm Visualization: Modeling complex logic where simple code comments are insufficient.
- Parallel Processing: Visualizing how a system handles multiple tasks simultaneously.
- Developer Communication: Providing a clear map for engineers to understand the control flow before writing code.
Deconstructing the Workflow: A Step-by-Step Example
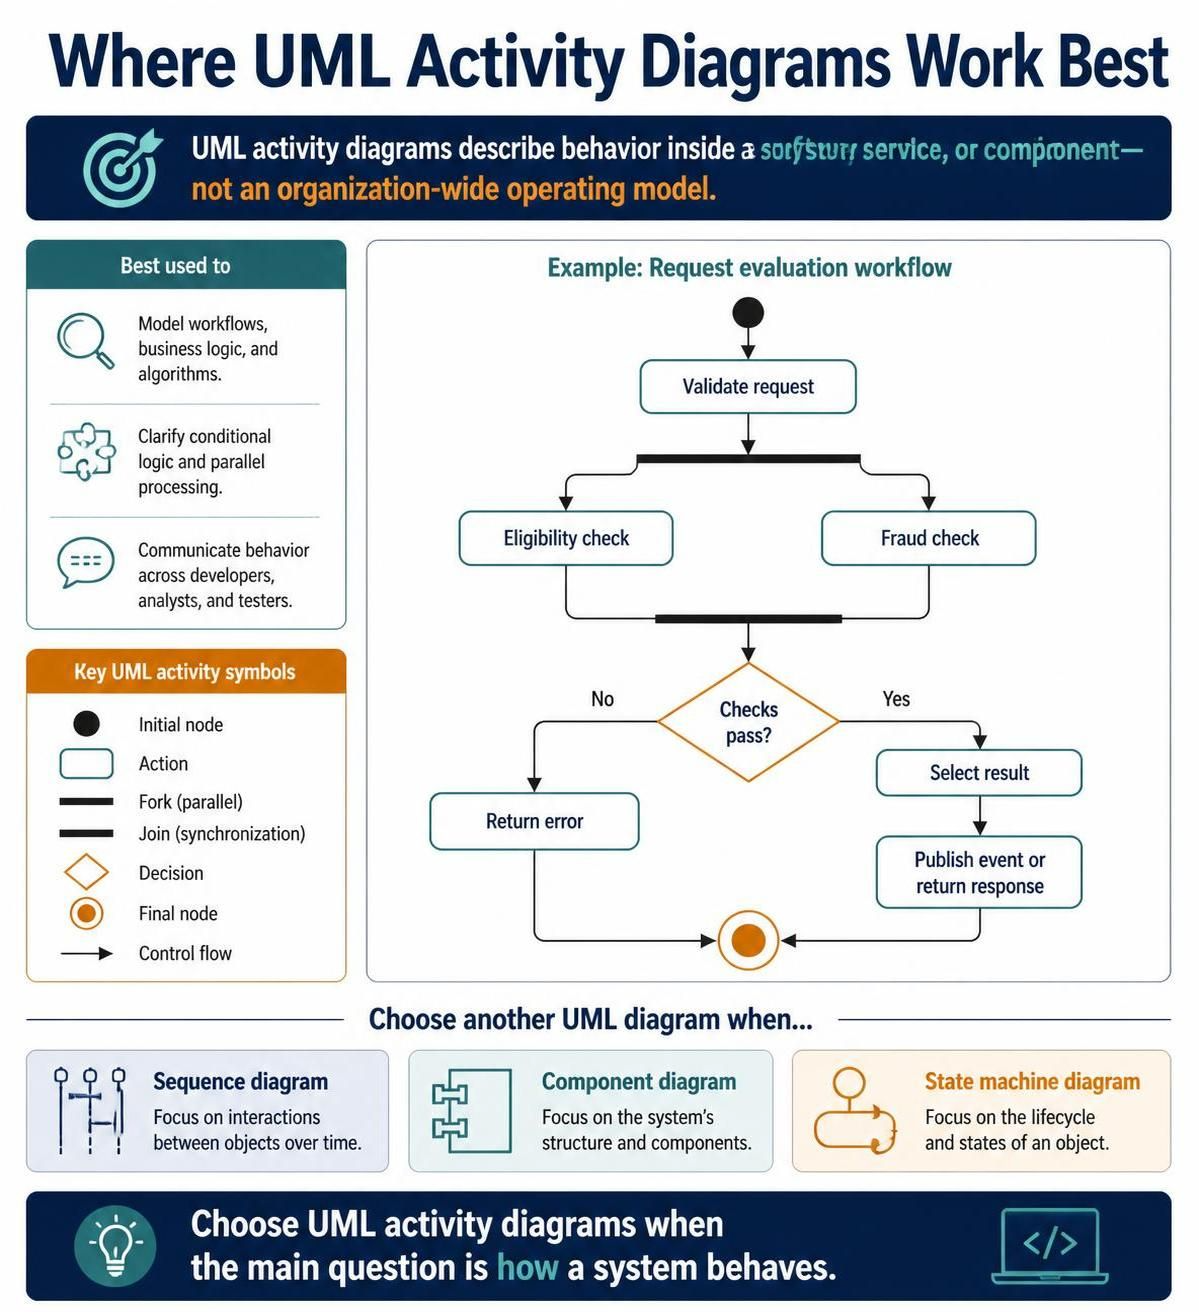
To understand the power of this diagram, let’s analyze the “Request Evaluation Workflow” shown in the context. This example demonstrates a common pattern in modern microservices architecture.
1. The Initial State and Action
The diagram begins with a solid black circle, known as the Initial Node. This represents the trigger for the system—perhaps an incoming API call. The first action is Validate Request, ensuring the data payload is syntactically correct.
2. The Fork: Introducing Concurrency
Notice the thick black horizontal bar branching downwards. In UML terminology, this is a Fork. This symbol indicates that the system is entering a state of concurrency. Instead of waiting for one task to finish before starting the next, the system initiates two tasks simultaneously:
- Eligibility Check: Determining if the user qualifies.
- Fraud Check: Analyzing the request for suspicious patterns.
3. The Join: Synchronization
Once both parallel threads are complete, the flow converges at a thick black bar from the bottom up. This is a Join (or Synchronization Bar). The system cannot proceed until both the eligibility and fraud checks have returned their results. This ensures data integrity before making a decision.
4. The Decision: Conditional Logic
Following the join, the flow hits a diamond shape, the Decision Node. Here, the system asks a binary question: Checks pass?
- If No: The flow moves to Return Error.
- If Yes: The flow moves to Select Result.
Choosing the Right Tooling: Visual Paradigm & AI
Creating these diagrams manually can be tedious, especially when managing complex synchronization points. Modern modeling tools like Visual Paradigm combined with AI assistance streamline this process.
When using tools like VPasCode or the AI features in Visual Paradigm, you can describe the logic in plain English, and the tool generates the activity diagram structure. For example, you might input a prompt like: “Create an activity diagram for a request handler that validates data, runs eligibility and fraud checks in parallel, joins them, and returns an error if checks fail.” The tool handles the placement of the Fork and Join bars automatically.
When NOT to Use Activity Diagrams
While powerful, UML Activity Diagrams are not a one-size-fits-all solution. The infographic highlights specific scenarios where other diagram types are superior:
- Sequence Diagrams: If your focus is on interactions between objects over time (e.g., specific method calls and return values between a Controller and a Database), use a Sequence Diagram.
- Component Diagrams: If you are focused on the structure of the system and how modules relate to one another physically or logically, a Component Diagram is the correct choice.
- State Machine Diagrams: If the behavior depends entirely on the lifecycle states of a single object (e.g., an Order moving from “Pending” to “Shipped”), a State Machine Diagram is more appropriate.
Conclusion
UML Activity Diagrams are the bridge between abstract business requirements and concrete software implementation. By mastering the symbols for Forks, Joins, and Decision nodes, you can clearly articulate complex system behaviors like parallel processing and error handling, ensuring that your development team builds exactly what the architecture demands.