Understanding the Architecture of Software Design
Welcome to today’s session on software architecture. If you have ever looked at a blueprint for a house, you understand that you need a plan before you start building. In the world of software engineering, that blueprint is known as the Unified Modeling Language, or UML. Today, we are going to break down the complex world of UML diagrams. By the end of this tutorial, you will understand how these diagrams are categorized and why distinguishing between them is crucial for effective system design.
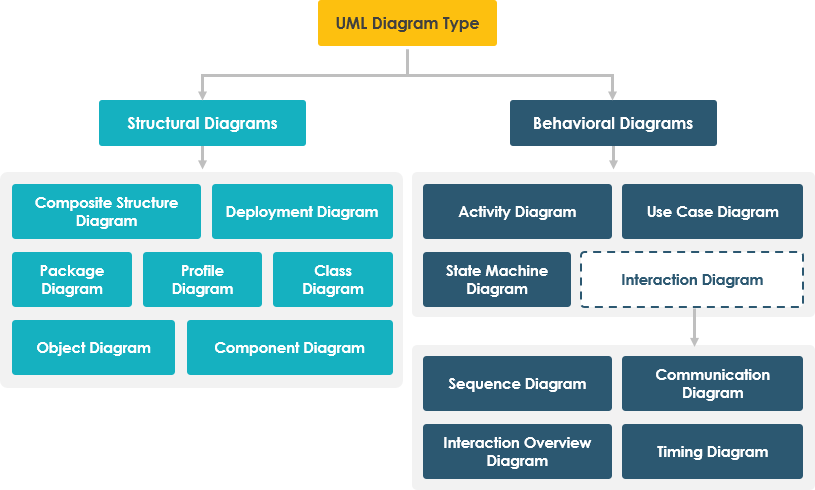
UML diagrams are broadly categorized into two main families: those that describe the static structure of a system and those that describe the dynamic behavior. Let’s dive deep into each of these branches.
The Structural Family: Static Blueprints
First, let’s look at Structural Diagrams. Think of these as the skeleton or the static anatomy of your software. They describe what a system is made of, rather than how it acts. These diagrams are essential for visualizing the static view of a system.
Within this category, we find several specific types of diagrams:
- Class Diagram: This is arguably the most common UML diagram. It shows the system’s classes, their attributes, operations, and the relationships among objects.
- Object Diagram: While a class diagram is a template, an object diagram is a snapshot. It shows specific instances of classes at a particular moment in time.
- Component Diagram: This focuses on the physical and software components of a system, helping you visualize how high-level modules interact.
- Deployment Diagram: This is crucial for infrastructure. It maps out the hardware topology, showing where software artifacts are physically deployed (e.g., servers, devices, nodes).
- Composite Structure Diagram: This dives deeper into the internal structure of a class, showing its parts and how they collaborate.
- Package Diagram: Software systems can get huge. Package diagrams help organize elements into groups or namespaces to manage complexity.
- Profile Diagram: This is used to customize UML for specific domains, allowing you to extend the language with new stereotypes.
The Behavioral Family: Dynamic Flows
Moving on to the second major category, we have Behavioral Diagrams. If structural diagrams are the skeleton, behavioral diagrams are the muscles and nerves. They describe how the system behaves and interacts over time.
This category is primarily divided into three key types:
- Use Case Diagram: This captures the requirements of a system. It depicts the interactions between users (actors) and the system itself, showing what the system does from the user’s perspective.
- Activity Diagram: Think of this as a sophisticated flowchart. It models the flow of control or data from activity to activity, often used to describe business processes or algorithms.
- State Machine Diagram: This describes the life cycle of an object. It shows the different states an object can be in (like “Idle,” “Processing,” or “Completed”) and the transitions that trigger changes between those states.
The Interaction Sub-Family
Within the behavioral family, there is a specialized subset known as Interaction Diagrams. These focus specifically on how objects communicate with one another to achieve a behavior. This is a critical distinction because it highlights the collaborative nature of software.
There are four specific diagrams you need to know here:
- Sequence Diagram: This is a time-ordered view. It shows how objects interact in the specific order that messages are received and sent.
- Communication Diagram: Similar to a sequence diagram but emphasizes the structural organization of the objects sending and receiving messages rather than the timing.
- Interaction Overview Diagram: This is a high-level view that combines elements of activity diagrams and sequence diagrams to show the flow of control between interactions.
- Timing Diagram: This is used for real-time systems where the timing of events is critical. It shows the states of objects and the transitions between them over a specific timeline.
Conclusion
By mastering these classifications, you move from simply drawing boxes and arrows to truly modeling complex systems. Whether you are designing a static database schema with Class Diagrams or mapping out a user’s journey with Use Case Diagrams, understanding this hierarchy is your first step toward becoming a proficient software architect.