Mastering Business Process Modeling with the Order Fulfillment Example
Welcome to this tutorial on Business Process Model and Notation (BPMN). To truly understand how to map out complex workflows, we need to look at a tangible scenario. Today, we are going to dissect a classic business process: the Order Fulfillment Process. By breaking this down, we will learn how to handle conditional logic, cross-departmental handoffs, and how to structure a professional diagram using tools like Visual Paradigm.
Setting the Stage: A Three-Lane Approach
Imagine a customer places an order. This is not just a single action; it is a journey that involves multiple teams. In our example, we have three distinct departments: the Sales Department, the Company Warehouse, and the Shipping Department.
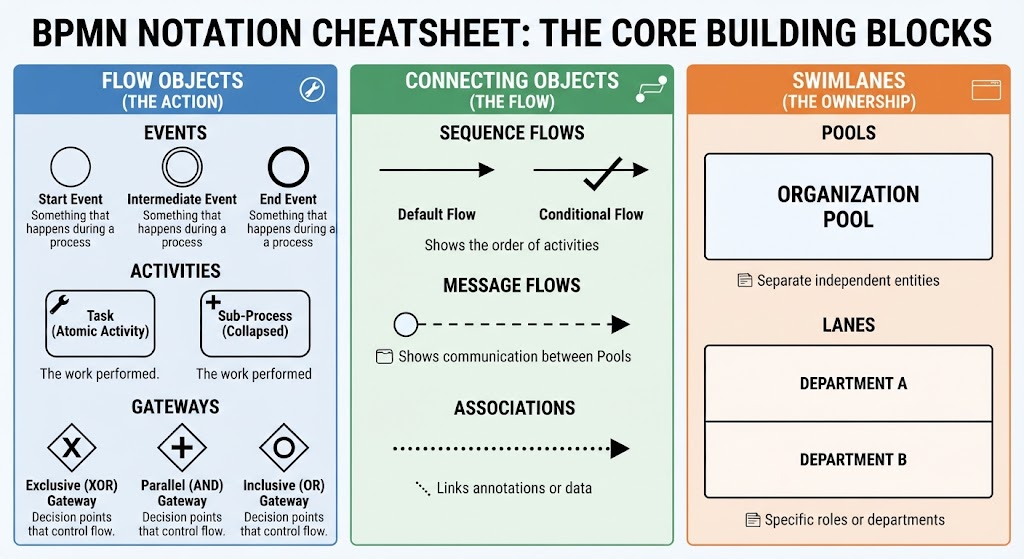
In BPMN, we represent these distinct responsibilities using Swimlanes. This is a critical feature for clarity. When you open Visual Paradigm, you will find that creating these lanes is intuitive. You can drag a “Pool” onto the canvas and then split it into three horizontal lanes, labeling them according to the departments involved. This visual separation immediately tells the viewer who is responsible for each step of the process.
Step-by-Step: Analyzing the Workflow
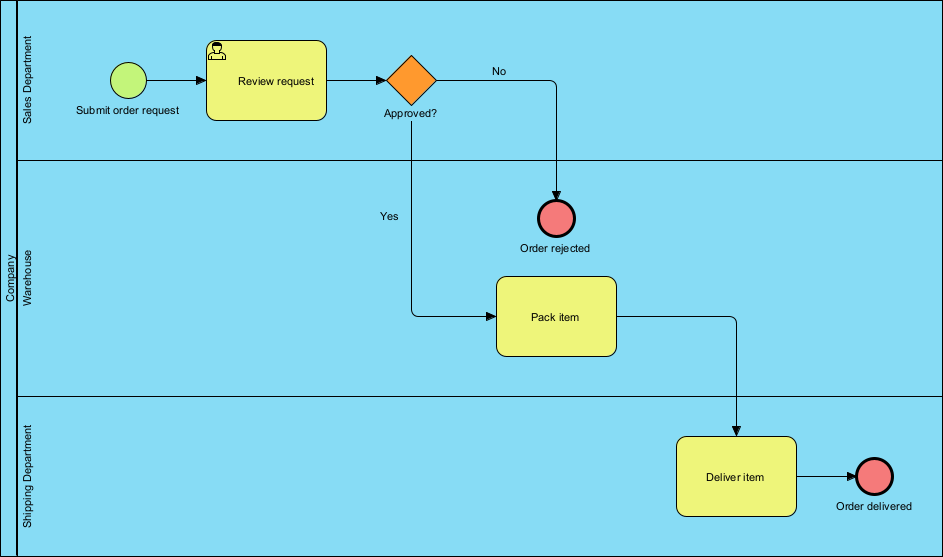
Let’s walk through the flow as it appears in our diagram, starting from the top lane.
1. The Initiation and Review
The process begins in the Sales Department. The customer submits an order request. In the diagram, this is represented by a Start Event (a green circle). The Sales team then performs a task: “Review request.” This is a standard BPMN task, represented by a rounded rectangle.
2. The Decision Point (Exclusive Gateway)
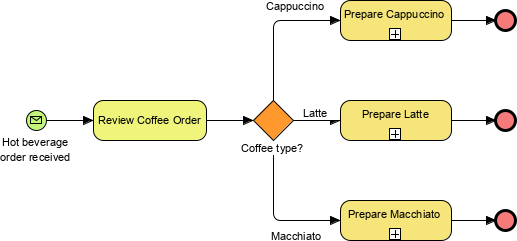
Here is where the logic comes in. After reviewing the request, the system must make a decision. The diagram features a diamond shape labeled “Approved?”. In BPMN terms, this is an Exclusive Gateway. It acts as a traffic light, forcing the process down one of two paths based on a condition.
Visual Paradigm handles these gateways effortlessly. When you place the gateway, you simply draw outgoing sequence flows and label them with your conditions, such as “Yes” or “No”.
- The “No” Path: If the request is not approved, the flow moves to a red circle labeled “Order rejected.” This is an End Event, signaling that the process stops for this specific order.
- The “Yes” Path: If the request is approved, the flow exits the gateway downwards.
3. Cross-Departmental Handoff
This is the most powerful aspect of this diagram. Once the “Yes” path is taken, the flow crosses the boundary from the Sales Department into the Company Warehouse lane. This visual crossing represents a handoff. The warehouse team now takes ownership of the process.
The task here is “Pack item.” Once packing is complete, the flow moves again, crossing into the bottom lane: the Shipping Department.
4. Final Delivery
In the final lane, the Shipping Department executes the “Deliver item” task. Upon successful completion, the flow reaches the final End Event labeled “Order delivered.” This red circle confirms that the business objective has been met.
Why Visual Paradigm is Ideal for This Workflow
When modeling a process like this, connectivity is key. In our diagram, you will notice how the lines connect seamlessly from the Sales lane, down to the Warehouse, and finally to Shipping. Visual Paradigm’s intelligent snapping features ensure that your connectors align perfectly with the swimlane boundaries, preventing messy diagrams.
Furthermore, managing the Exclusive Gateway logic is streamlined. Instead of manually calculating paths, you simply define the condition. If you later decide to add a third outcome—perhaps “Pending Review”—you can simply add another outgoing flow from the diamond, and the tool will automatically adjust the layout to accommodate the new logic.
Conclusion
By following this Order Fulfillment example, we have demonstrated how to transform a text-based description into a structured, logical visual map. We utilized swimlanes to define roles, tasks to define actions, and gateways to define logic. Whether you are an analyst or a developer, mastering these elements in Visual Paradigm will allow you to design robust, error-free business processes that are easy for everyone to understand.