


Mastering UML Class Diagrams: A Deep Dive into Object-Oriented Design
Welcome to this comprehensive tutorial on UML Class Diagrams. If you are an aspiring software architect, a developer, or simply someone interested in system design, understanding the static structure of your application is crucial. Class diagrams are the most widely used diagrams in the Unified Modeling Language (UML) and serve as the blueprint for your software’s object-oriented structure.
In this session, we will analyze a practical example involving an e-commerce system to understand the fundamental building blocks of a class diagram. We will explore how to define classes, manage their attributes and operations, and establish the complex relationships that bind them together. Throughout this guide, we will see how professional modeling tools like Visual Paradigm streamline these processes, allowing you to focus on design rather than syntax.
The Foundation: Classes, Attributes, and Operations
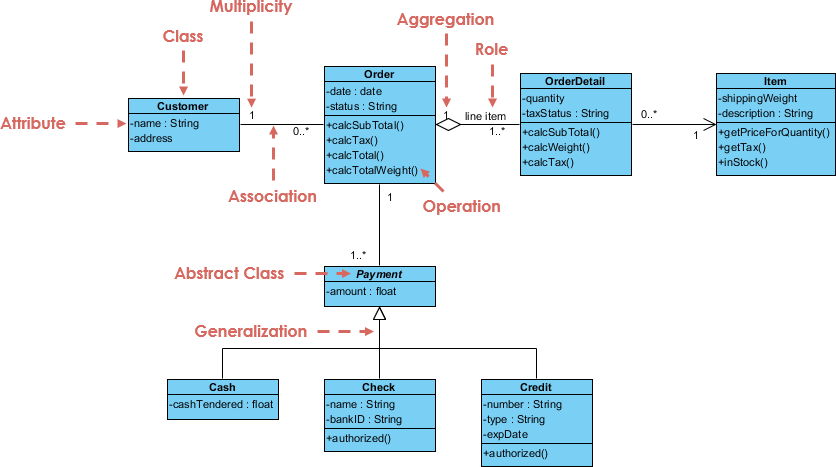
At the heart of every class diagram are the Classes. In our diagram, you can see several distinct classes represented by blue rectangular boxes, such as Customer, Order, and Item. A class represents a blueprint for creating objects that share the same structure and behavior.
Inside each class box, we typically find three compartments. The top holds the class name, the middle holds the Attributes, and the bottom holds the Operations. Let’s look at the Customer class. It defines attributes like -name : String and -address. These represent the data that objects of this class will hold. The minus sign (-) indicates private visibility, meaning this data is encapsulated and not directly accessible from outside the class.
Beneath the attributes in the Order class, we find a list of operations such as +calcSubTotal() and +calcTotalWeight(). These are the methods or functions that the class can perform. The plus sign (+) indicates public visibility. In Visual Paradigm, defining these elements is intuitive; you can simply drag a class onto the canvas and toggle the visibility of attributes and operations using a simple context menu, ensuring your design adheres strictly to your visibility constraints.
Connecting the Dots: Associations and Multiplicity
Classes rarely exist in isolation. They interact with one another through Associations. An association is depicted as a solid line connecting two classes. In our example, there is a clear association between Customer and Order. This line signifies that a Customer is linked to an Order.
However, a simple line doesn’t tell the whole story. We need to know how many of each object are involved in this relationship. This is where Multiplicity comes in. Multiplicity specifies the number of instances of one class that may relate to a single instance of the other class.
- 1: On the Customer side, the number 1 indicates that a specific Order is placed by exactly one Customer.
- 0..: On the Order side, the notation 0.. (zero to many) indicates that a single Customer can place zero orders or many orders over time.
Visual Paradigm makes managing these constraints incredibly efficient. Instead of manually typing text, you can simply click on the association line and select from a dropdown menu of multiplicity options, instantly updating the diagram to reflect your business rules accurately.
Complex Relationships: Aggregation and Roles
Sometimes, relationships are stronger or more specific than a standard association. Look at the connection between Order and OrderDetail. This line features a hollow diamond shape at the Order end. This symbol represents an Aggregation relationship, often described as a “whole-part” relationship.
Aggregation implies that the part (OrderDetail) can exist independently of the whole (Order). While an order is composed of line items, if you cancel an order, the concept of a “line item” or “product” might still exist in your database or catalog. In Visual Paradigm, you can easily switch between different relationship types (Association, Aggregation, Composition, Generalization) using the relationship palette, ensuring your diagram accurately reflects the lifecycle dependencies of your objects.
Additionally, notice the text line item placed near the OrderDetail class. This is a Role. A role name describes the capacity in which one class participates in an association. It clarifies that from the perspective of the Order, the OrderDetail is acting as a “line item”. This adds semantic clarity to your model, making it easier for stakeholders to understand the specific nature of the interaction.
Inheritance and Abstraction
One of the most powerful features of object-oriented programming is inheritance, which allows you to create a hierarchy of classes. In our diagram, this is represented by the relationship between Payment, Cash, Check, and Credit.
The solid line with a hollow triangle pointing to Payment represents Generalization. This is the “Is-A” relationship. A Cash payment is a type of Payment. A Credit payment is also a type of Payment. This allows us to define common attributes (like the amount) in the parent class and specific behaviors in the child classes.
Notably, the Payment class is marked as an Abstract Class. In UML, this is often denoted by italics or a specific stereotype, though in Visual Paradigm, it is a distinct configuration option. An abstract class cannot be instantiated directly; you cannot create a generic “Payment” object. You must create a specific instance like a Cash object. This enforces strict design patterns where the parent class defines the contract, and child classes fulfill it. Visual Paradigm supports this natively, allowing you to generate code that correctly marks the parent class as abstract and implements the necessary interfaces.
Conclusion
By breaking down this diagram, we have seen how UML provides a standardized language for visualizing software architecture. From defining the internal structure of a class to modeling complex inheritance hierarchies, every element serves a purpose. Tools like Visual Paradigm act as a bridge between these abstract concepts and concrete implementation, offering features like round-trip engineering, where your diagrams can directly generate code, and vice versa. Mastering these diagrams is the first step toward building robust, scalable, and maintainable software systems.