In the world of software development and system architecture, documentation is often the most neglected yet critical component. While creating diagrams in Visual Paradigm Online allows you to visualize complex structures and data flows, these visuals need to live within a cohesive narrative to be truly effective. This is where the integration with OpenDocs becomes a game-changer for teams aiming for seamless collaboration.
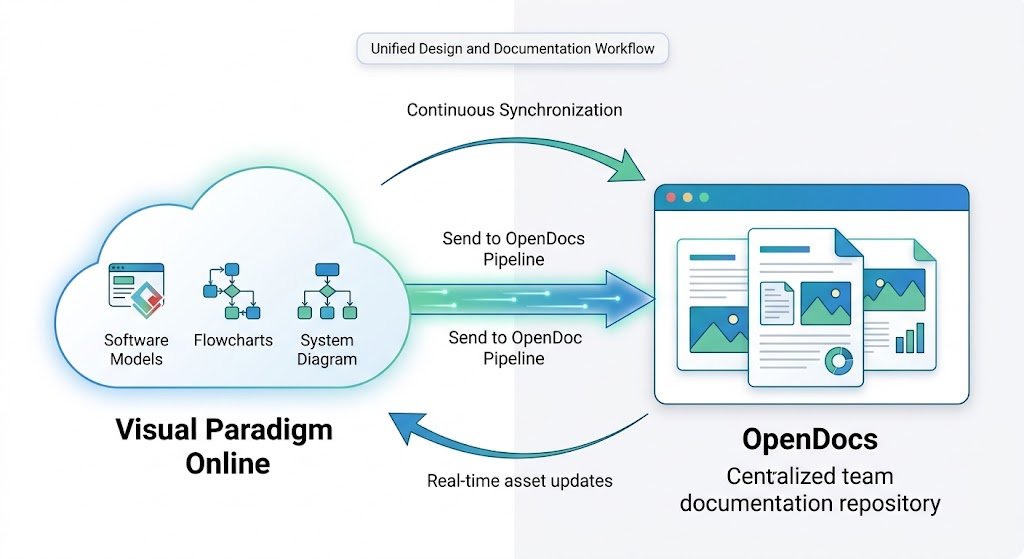
Imagine you have just finished designing a detailed chart or a structural graph. Instead of saving it as a static image file and hunting for a way to attach it to a document later, Visual Paradigm offers a direct pipeline. This tutorial will guide you on how to export your web-based cloud diagrams or structural graphs natively into OpenDocs, ensuring your visual data is always up-to-date and easily accessible.
The Export Workflow: From Canvas to Pipeline
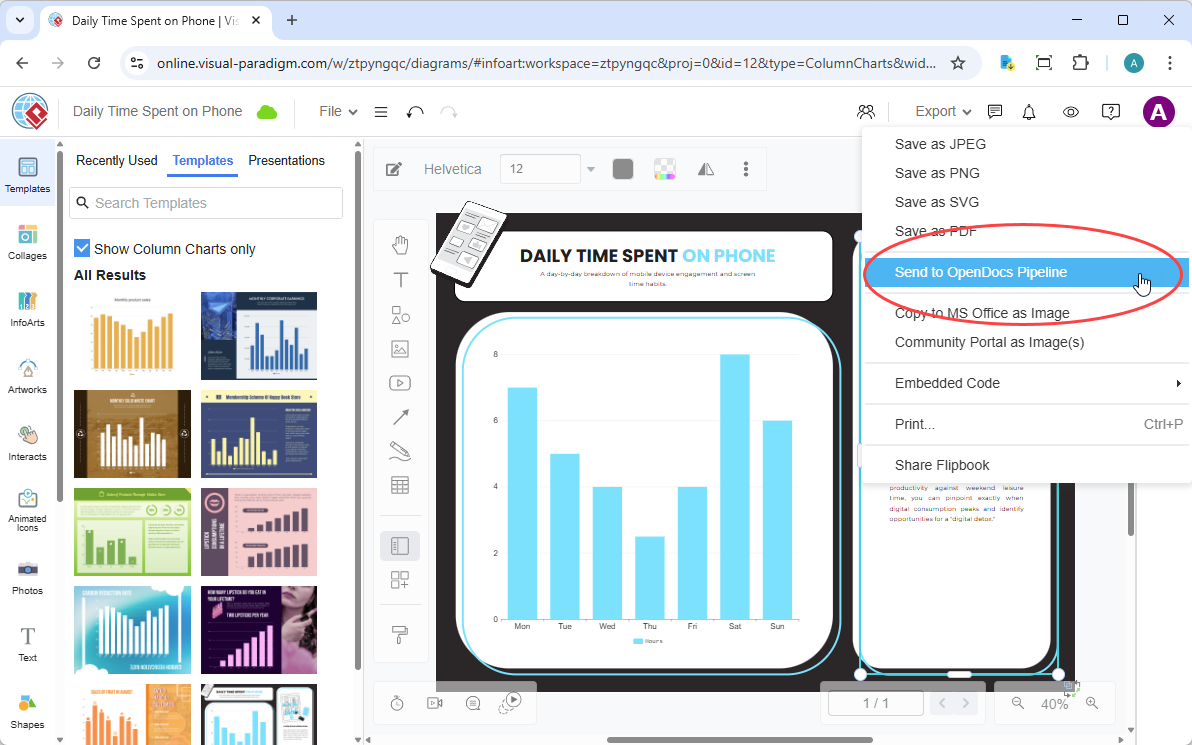
The process of moving an artifact from your design environment to your documentation hub is streamlined through the native export features found within the Visual Paradigm Online interface. When you are working on a diagram, such as the “Daily Time Spent on Phone” chart shown in our example, you have access to powerful tools that go beyond simple image saving.
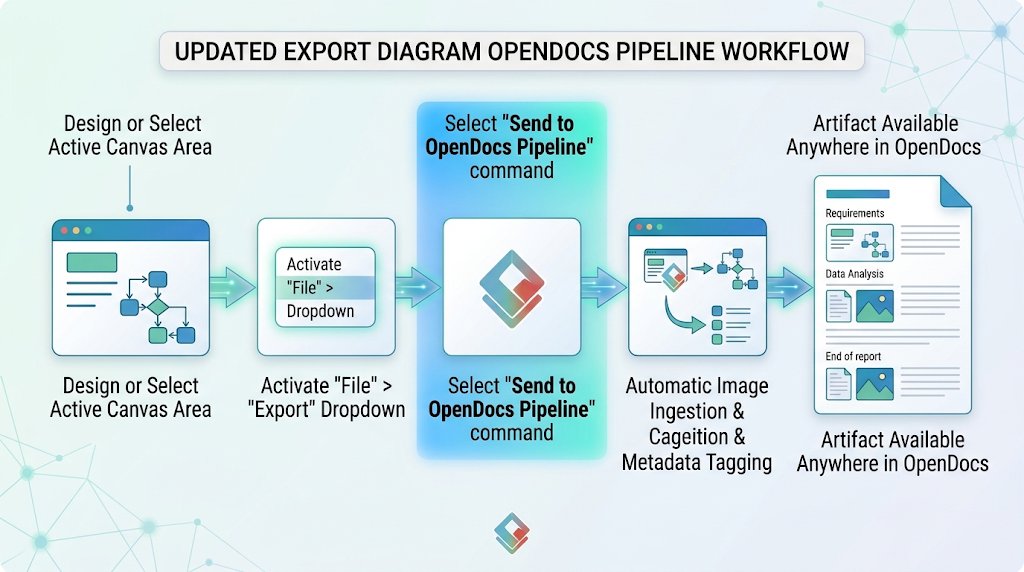
To initiate this transfer, you need to look at the top toolbar where the File and Export options reside. Here is how the workflow functions effectively:
- Locate the Export Menu: Once your diagram is selected or active, navigate to the Export dropdown menu. This area typically houses various output formats like JPEG, PNG, or PDF.
- Select the Pipeline Option: Instead of choosing a standard file format, look for the specific command labeled Send to OpenDocs Pipeline. In the interface, this option is highlighted to indicate its importance as a bridge between the modeling and documentation tools.
- Confirm the Transfer: By clicking this option, the system automatically pushes the selected artifact—the diagram, chart, or graph—into the designated pipeline. This action prepares the file for immediate ingestion into your team’s documentation space.
Integrating Artifacts into OpenDocs
Once the artifact has been sent to the pipeline, the real power of team collaboration begins. The “Send to OpenDocs Pipeline” feature is designed to be frictionless, allowing you to treat your diagrams as first-class citizens within your documentation.
When you open your project in OpenDocs, you will find that these exported artifacts are ready to be utilized. You are not limited to placing them at the end of a report or within a specific attachment folder. Instead, you can insert them anywhere within the document structure. This flexibility allows you to:
- Embed a data chart directly next to the textual analysis of that data.
- Place a structural graph at the beginning of a requirements document to provide immediate context.
- Update the diagram in Visual Paradigm Online later; the linked artifact in OpenDocs can reflect these changes, ensuring your documentation never becomes obsolete.
Why This Integration Matters
Visual Paradigm facilitates this workflow because it understands that design and documentation are not separate silos. By utilizing the Send to OpenDocs Pipeline, you ensure that your team maintains a single source of truth. Your diagrams are not just static pictures; they are dynamic assets that can be referenced, updated, and shared instantly.
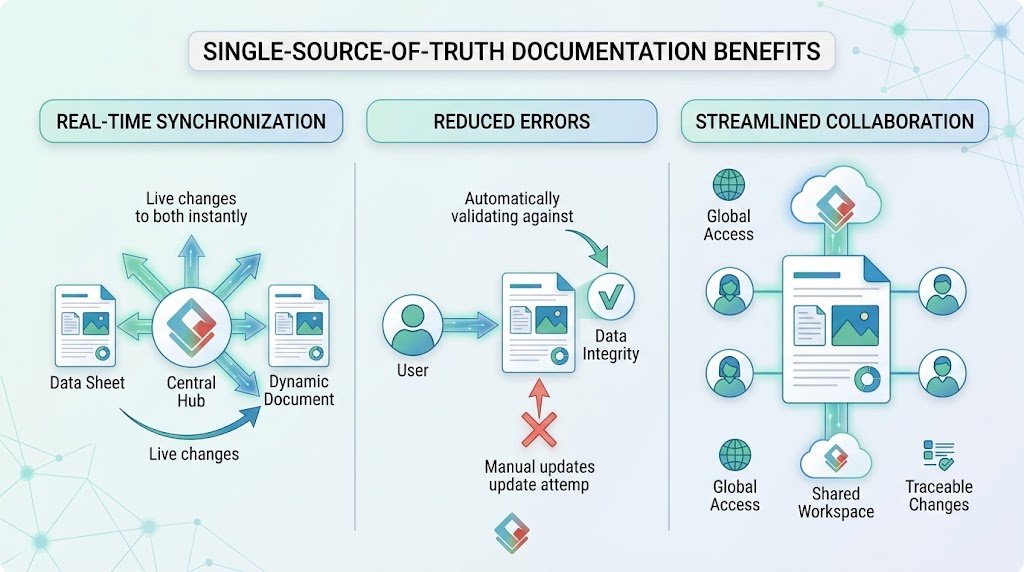
Whether you are presenting a “Daily Time Spent on Phone” breakdown or mapping out a complex cloud architecture, this native export capability ensures your visual insights reach your audience exactly where they need to be: inside the collaborative documents where decisions are made.