


In the complex world of software engineering, understanding how systems interact is just as important as knowing what they do. While Use Case diagrams tell us about the functional goals of a system, they often lack the precision required to design the underlying logic. This is where UML Sequence Diagrams come into play. They provide a detailed, chronological view of the messages exchanged between objects, acting as a bridge between high-level requirements and concrete code implementation.
Based on the classic example of an ATM interaction, this tutorial will walk you through the anatomy of a sequence diagram, how to interpret its visual language, and how to model complex constraints.
What is a Sequence Diagram?
A Sequence Diagram is a type of UML interaction diagram. It describes an interaction among a set of objects or participants in a collaboration. The primary characteristic of this diagram is its focus on time. It arranges participants in a chronological order, showing exactly when messages are sent and when they are received.
Sequence diagrams are essential for:
- Refining Requirements: Transforming abstract use cases into concrete scenarios.
- Visualizing Logic: Showing the order of interactions visually using the vertical axis to represent the passage of time.
- Modeling Granularity: Capturing interactions at various levels, from high-level system-to-system communication (System Sequence Diagrams) to detailed object-to-object collaboration (Instance Diagrams).
Anatomy of the Diagram: The ATM Example
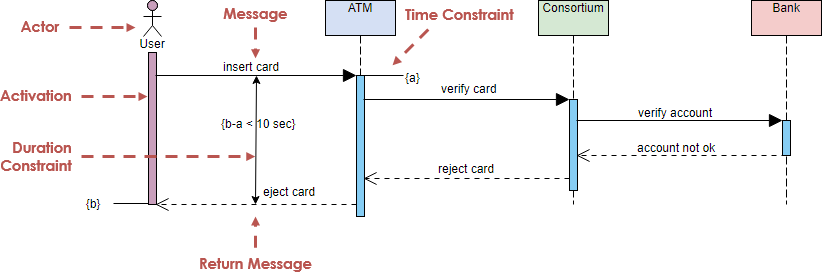
Let’s analyze the provided diagram which models an ATM transaction. This example perfectly illustrates how to represent actors, lifelines, and the flow of control.
1. Participants and Lifelines
Participants are the “lifelines” of the interaction. In the diagram, you can see:
- User (Actor): Represented by the stick figure, this is the human initiating the process.
- ATM, Consortium, Bank: These are the system components (objects) that participate in the interaction.
Visually, these are represented by rectangles at the top of the diagram, with a vertical dashed line extending downwards. This dashed line represents the existence of the object over time.
2. Messages and Interactions
Messages are the lines connecting the lifelines. They represent calls, signals, or returns.
- Request Messages: Represented by solid lines with open arrowheads. For example, insert card is a request from the User to the ATM.
- Return Messages: Represented by dashed lines with open arrowheads. For example, eject card is a return message from the ATM back to the User.
3. Activation Bars
The thin rectangles on the lifelines (often blue or purple in diagrams) represent Activation or Execution Occurrences. An activation bar indicates that the object is performing an action or is waiting for a response. When a message is received, the activation bar starts. When the object finishes its task and sends a return message, the bar ends.
4. Constraints and Timing
Real-world systems often have strict time requirements. Sequence diagrams allow us to annotate these constraints directly onto the diagram.
- Time Constraints: The label Time Constraint points to the interaction between the ATM and the Consortium, indicating that specific time limits apply to this exchange.
- Duration Constraints: The notation {b-a < 10 sec} specifies that the duration of the entire transaction (from start ‘a’ to end ‘b’) must be less than 10 seconds. This is critical for User Experience (UX) design.
- Message Labels: Labels like {a} and {b} mark specific points in time or events to make referencing easier for constraints.
Levels of Granularity in Modeling
Depending on your project phase, you might need different types of sequence diagrams:
High-Level Interactions
These are often called System Sequence Diagrams (SSD). They focus on the interaction between the user and the system as a whole, or between the system and external systems. For the ATM example, a high-level diagram might simply show the User sending “Withdraw Cash” to the ATM, ignoring the internal steps of verifying the card.
Instance Diagrams (Detailed)
These diagrams drill down into the collaboration that realizes a specific use case or operation. They show the interaction between specific objects (e.g., the ATM controller, the Database, the Bank Gateway). This is the most common form used during the design and coding phase.
Architectural Patterns
Sequence diagrams are also vital for modeling architectural patterns like MVC (Model, View, Controller). They help visualize how the Controller receives a user request (View), updates the Model, and how the View displays the result.
Conclusion
Sequence diagrams are a powerful tool for bridging the gap between abstract requirements and concrete implementation. By visualizing the chronological order of messages and the activation of objects, developers and stakeholders can identify potential bottlenecks, timing issues, and logical gaps early in the design process.