BPMN

BPMN Gap Analysis As Is To Be State Diagram

BPMN Gap Analysis As Is To Be State Diagram

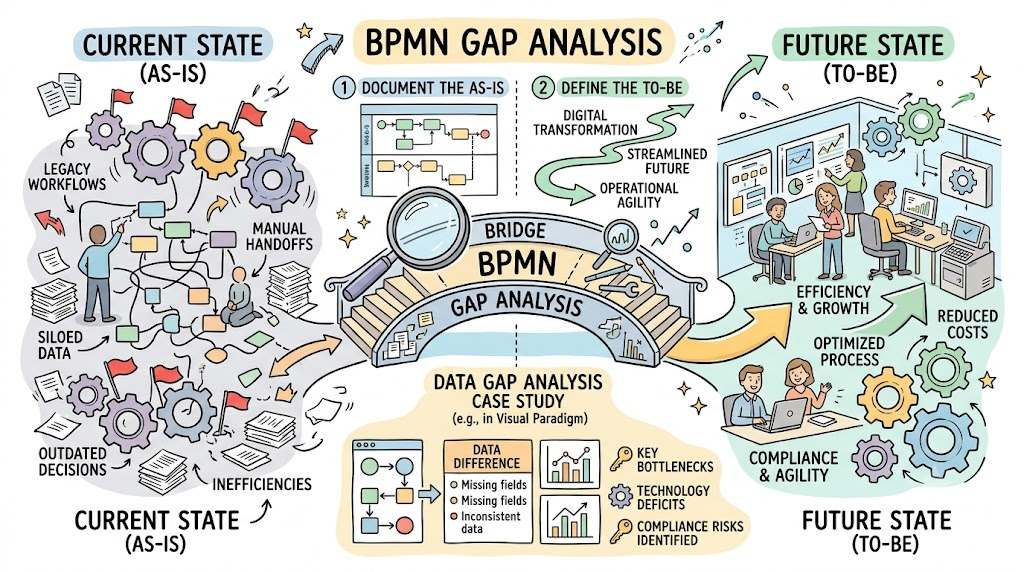
In today’s rapidly evolving business landscape, operational agility is not just an advantage—it is a necessity. Organizations often find themselves trapped in legacy workflows that rely on manual handoffs, siloed data, and outdated decision-making frameworks. The bridge between these inefficient current states and a streamlined future lies in Business Process Model and Notation (BPMN) Gap Analysis.

While many organizations document their processes, few effectively leverage those diagrams as diagnostic tools. A true Gap Analysis goes beyond simple documentation; it systematically compares the “AS-IS” reality against a “TO-BE” vision to expose bottlenecks, technology deficits, and compliance risks. This tutorial provides a step-by-step framework for conducting this analysis, using a real-world Data Gap Analysis case study to illustrate how tools like Visual Paradigm can transform static diagrams into dynamic roadmaps for digital transformation. By mastering this methodology, process architects and analysts can move from merely describing work to actively engineering efficiency.
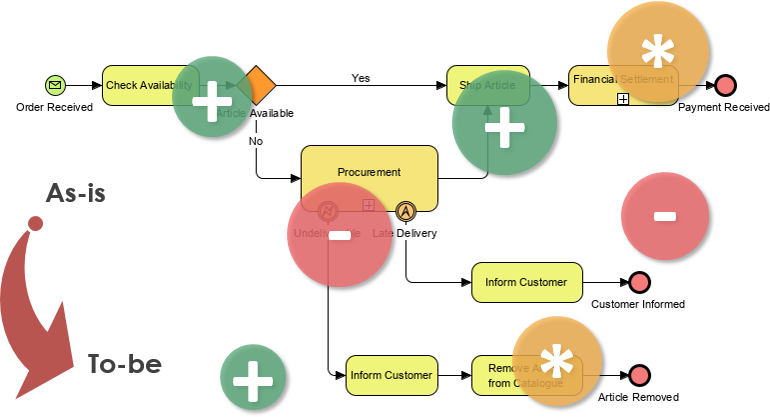
As-is To-be Procurement Process Flow Diagram

As-is To-be Procurement Process Flow Diagram

What is As-Is / To-Be Process?
The as-is state of a process is the “now” state. It’s how the process operates before you make any changes or improvements. The to-be process, on the other hand, is the future state.

The “as-is” allows you to get an accurate view of how the process currently works. Once you already know how the process is, you can analyze it and propose certain improvements. BPMN is the most widely used notation for documenting the GAP analysis.

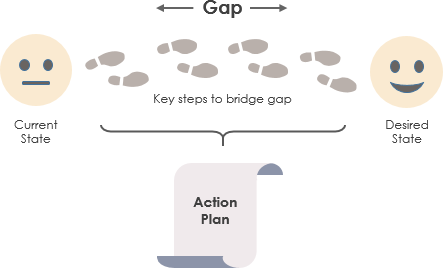
Gap refers to the space between “where we are” (the present state) and “where we want to be” (the target state). A company can recognize its current state—by measuring time, money, and labor—and compare it to its target state. By defining and analyzing these gaps, the management team can create an action plan to move the organization forward and fill in the performance gaps.

What is Business Process Diagram?
Business Process Modelling Notation (BPMN) is a methodology for business process modeling. It supports the specification of business processes in a graphical notation (Business Process Diagram) based on the concept of activity diagrams from the Unified Modelling Language (UML). BPMN provides businesses with the capability of understanding their internal business procedures in a graphical notation and will give organizations the ability to communicate these procedures in a standard manner. This will ensure that all business stakeholders, IT Professional and other participants in their business communicate effectively and will enable organizations to deal with changes clearer, quicker and better.

Gap Between Current And Desired State With Action Plan

Gap Between Current And Desired State With Action Plan

Gap analysis involves the comparison of actual performance with potential performance. For example, a company does not make the best use of current resources, it may perform below an idealized potential. In other words, gap analysis is the process people use to examine their current state (or as-is process) with their desired state (to-be process) of a company.

One effective technique for transforming vision into results is to develop and populate an As-Is and To-Be BPMN diagrams. The As-Is diagram describes the present state of the organization’s process, culture, and capabilities. The To-Be diagram describes the future state; in other words, how the organization’s process, culture, and capabilities will appear in the future. This studying of the As-is and To-be process results in identifying the difference between the current and target business state, known as the gap, which is an important part of any business process reengineering/improvement initiative.

What is As-Is / To-Be Process?
The as-is state of a process is the “now” state. It’s how the process operates before you make any changes or improvements. The to-be process, on the other hand, is the future state.

The “as-is” allows you to get an accurate view of how the process currently works. Once you already know how the process is, you can analyze it and propose certain improvements. BPMN is the most widely used notation for documenting the GAP analysis.

Gap refers to the space between “where we are” (the present state) and “where we want to be” (the target state). A company can recognize its current state—by measuring time, money, and labor—and compare it to its target state. By defining and analyzing these gaps, the management team can create an action plan to move the organization forward and fill in the performance gaps.

Online Shop Sales Representative Order Process Flow Diagram

Online Shop Sales Representative Order Process Flow Diagram

Capture the Current Process in As-is Process
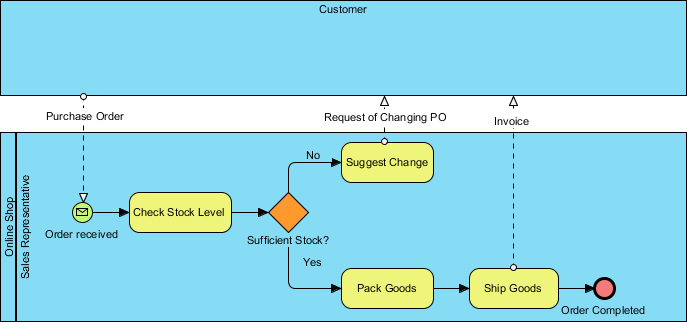
In the online shop example below, the process begins with the sales representative receives a purchase order from a customer and proceeds to check the stock level. If there is enough stock on hand to meet with the order, the sales representative will pack them. The process ends with shipping them along with an invoice. In case of insufficient stock, the sales representative will suggest the customer amend the purchase order.

Mastering Process Boundaries: The Power of Blackbox Pools

Mastering Process Boundaries: The Power of Blackbox Pools

Understanding Blackbox Pools A blackbox pool models entities external to the process whose internal flow does not impact the modeled scope. For instance, if modeling a chef’s meal preparation, the customer is a blackbox. Conversely, if modeling the customer ordering experience, the chef becomes the blackbox. Note: While lanes can be nested, avoid using them solely to model organizational hierarchy. Use organization charts for structural reporting and BPMN lanes strictly for process responsibility.

Understanding the Architecture of Process Models: Pools and Lanes

Understanding the Architecture of Process Models: Pools and Lanes

Swimlanes: Pools and Lanes Swimlanes are graphical containers representing process participants. They organize activities by role or entity. There are two types of swimlanes: Pools: Represent major participants (e.g., a department, vendor, or customer). A pool may contain flow elements or be a “Blackbox Pool” if the internal workings are irrelevant to the current model. Lanes: Sub-partitions within pools that specify responsibilities (e.g., Department Head vs. General Clerk).

Welcome to the Journey of Business Process Modeling

Welcome to the Journey of Business Process Modeling

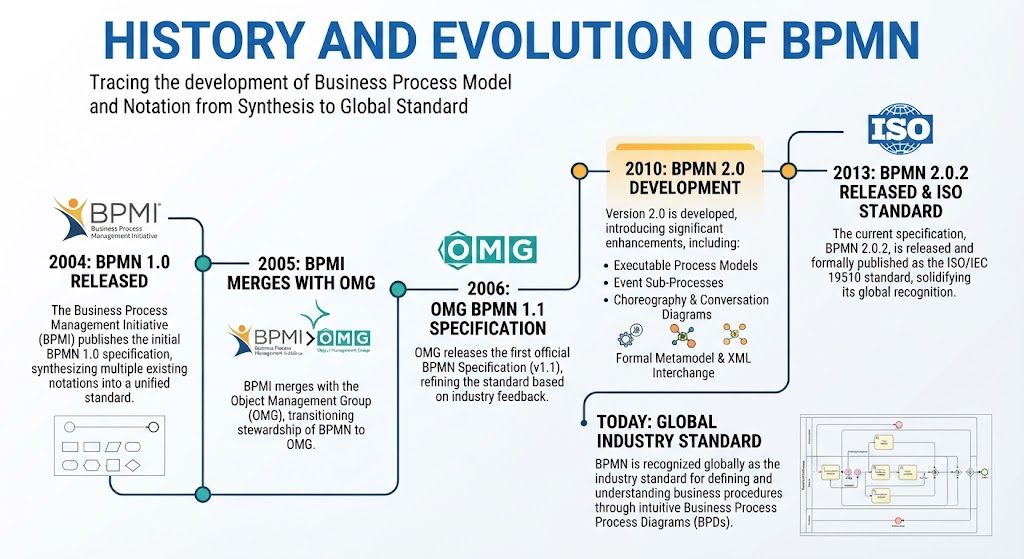
History and Evolution of BPMN BPMN was derived from the synthesis of multiple business modeling notations to create a unified standard. Originally published by the Business Process Management Initiative (BPMI) in 2004, the notation has evolved significantly: 2005: BPMI merged with the OMG. 2006: OMG released the first BPMN Specification. 2010: Version 2.0 was developed, introducing significant enhancements. 2013: The current specification (BPMN 2.0.2) was released and formally published as the ISO/IEC 19510 standard. Today, BPMN is recognized globally as the industry standard for defining and understanding business procedures through intuitive Business Process Diagrams (BPDs).

Mastering the Visual Language of Business: BPMN

Mastering the Visual Language of Business: BPMN

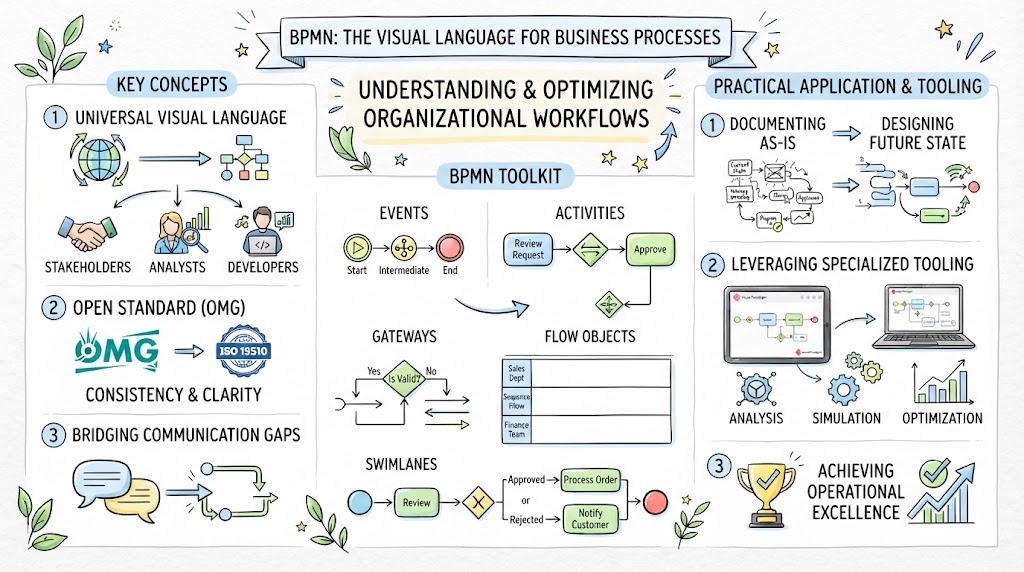
In the modern business landscape, understanding how an organization operates is the first and most critical step toward improvement. Business Process Model and Notation (BPMN) serves as the universal visual language for this purpose. As an open standard maintained by the Object Management Group (OMG) and formalized as ISO/IEC 19510, BPMN provides a graphical representation of workflows that bridges the communication gap between business stakeholders, analysts, and technical developers. This comprehensive guide explores the history, core elements, and practical application of BPMN. Furthermore, it highlights how leveraging specialized tooling like Visual Paradigm can transform static diagrams into dynamic assets for process analysis, simulation, and optimization. Whether you are documenting an “As-is” process or designing a future state, mastering BPMN is essential for operational excellence.

Why Visual Paradigm for Gap Analysis?

Why Visual Paradigm for Gap Analysis?

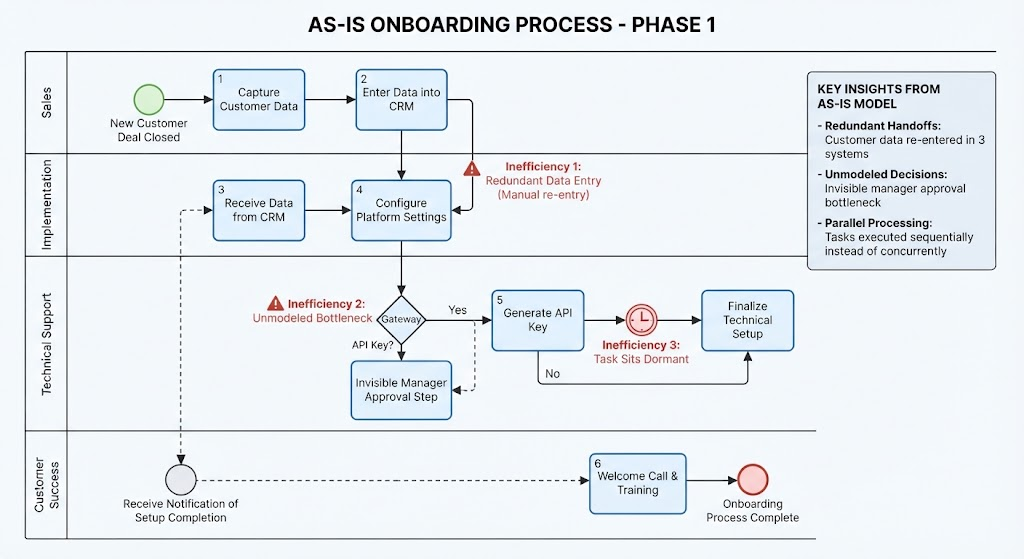
Why Visual Paradigm for Gap Analysis? Before diving into the case, it is worth noting why Visual Paradigm was selected over generic diagramming tools or other BPM suites: True BPMN 2.0 Compliance: Ensures models are analyzable, not just illustrative. Integrated Gap Analysis Features: Built-in support for overlaying As-Is and To-Be models with annotation layers. Process Simulation: Ability to test To-Be models against historical As-Is data before implementation. Requirements Traceability: Links process gaps directly to business requirements and user stories. Collaborative Workspace: Enables real-time stakeholder validation during modeling workshops. Phase 1: Modeling the As-Is Reality The first step in any credible gap analysis is establishing an uncontested baseline. Using Visual Paradigm, the team conducted three facilitated modeling sessions with frontline staff. Key Tooling Application: Swimlane Discovery Using Visual Paradigm’s swimlane auto-layout, the team mapped the onboarding process across four departments: Sales, Implementation, Technical Support, and Customer Success. The tool’s ability to quickly reorganize lanes as understanding evolved was critical—early models placed “API Key Generation” in Implementation, but discovery revealed it actually sat dormant in Technical Support for an average of 6 days. The As-Is Model Revealed Hidden Gaps Once modeled, Visual Paradigm’s path analysis highlighted several immediate issues that interviews alone had missed: Redundant Handoffs: Customer data was manually re-entered in three separate systems. Unmodeled Decision Points: A “manager approval” step existed in practice but had never been documented, creating an invisible bottleneck. Parallel Processing Failures: Tasks that could run concurrently were being executed sequentially due to legacy policy. 💡 Key Insight: The As-Is model itself became the first gap identification tool. Simply rendering the process visually exposed structural inefficiencies that stakeholders had normalized through familiarity.

Introduction: The Ambition-Clarity Paradox

Introduction: The Ambition-Clarity Paradox

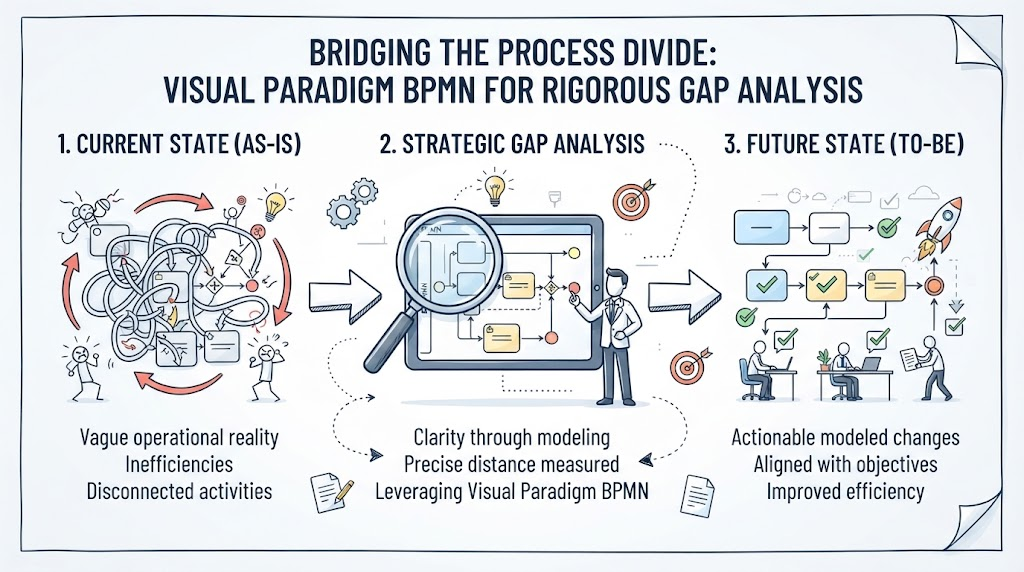
Business improvement initiatives often fail not because of a lack of ambition, but because of a lack of clarity. Organizations frequently struggle to articulate the precise distance between their current operational reality and their strategic objectives. This “process divide” is where gap analysis lives, and it is where Business Process Model and Notation (BPMN) tooling becomes indispensable. This article explores a real-world case study demonstrating how Visual Paradigm’s BPMN capabilities were leveraged to conduct a rigorous gap analysis, transforming vague improvement goals into actionable, modeled process changes.

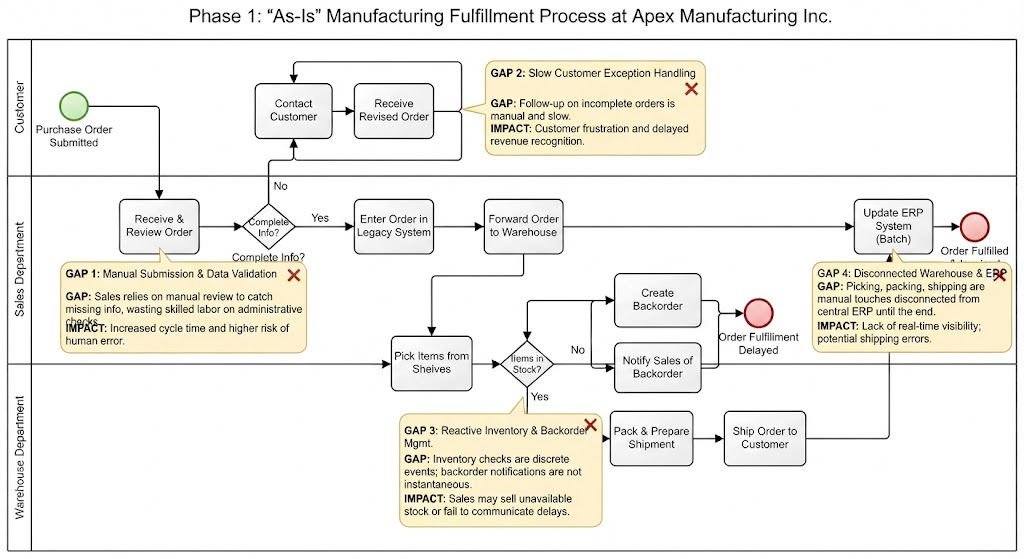
Understanding Process Improvement: An “As-Is” Analysis of Apex Manufacturing Inc.

Understanding Process Improvement: An “As-Is” Analysis of Apex Manufacturing Inc.

Analysis of the As-Is State: Manual Submission: The customer submits a purchase order, which enters the Sales Department lane without pre-validation. Reactive Error Handling: If information is incomplete (“Complete Info? -> No”), a sales representative must manually “Contact Customer.” This creates a delay loop that halts the process until the customer responds. Siloed Warehouse Operations: The Warehouse Department checks inventory manually. If items are missing, a backorder is created, and sales is notified via a separate, likely non-integrated channel. Delayed ERP Updates: The “Update ERP System” task occurs late in the cycle, meaning financial and inventory data may be out of sync during the picking and packing phases. Phase 2: Identifying the Gaps A detailed gap analysis reveals four critical areas for improvement: Order Submission & Data Validation: Gap: Sales relies on manual review to catch missing info, wasting skilled labor on administrative checks. Impact: Increased cycle time and higher risk of human error. Customer Exception Handling: Gap: Follow-up on incomplete orders is manual and slow. Impact: Customer frustration and delayed revenue recognition. Inventory and Backorder Management: Gap: Inventory checks are discrete events rather than continuous monitoring; backorder notifications are not instantaneous. Impact: Sales teams may sell stock that isn’t available, or fail to communicate delays proactively. Warehouse Fulfillment & ERP Synchronization: Gap: Picking, packing, and shipping are manual touches disconnected from the central ERP until the end of the process. Impact: Lack of real-time visibility into order status and potential shipping errors

返回頂端